グラフの配色を変えようと思って display.brewer.all() コマンドでパレットを眺めていた時に、 colorblindFriendly オプションを発見。
library(RColorBrewer)
display.brewer.all() #全色表示させる
display.brewer.all(colorblindFriendly=T) #色弱の方に優しいパレット
せっかくだから、作成したグラフがどんな感じに見えたりするのかシミュレーションできないかなって思って探してみたら、 colorblindr っていうパッケージが。ってなわけで、そのインストール方法と使い方です。
環境
- R Open 3.5.1 又は R3.6
- Lubuntu 16.04
という訳でインストール
まずは必要となるライブラリをインストールしておきます。以下のコマンドは R 上ではなく Ubuntuのコンソール上で実行します。
sudo apt -y install build-essential
sudo apt -y install libssl-dev
sudo apt -y install libjpeg9-dev
sudo apt -y install libxml2-dev
sudo apt -y install libcurl4-openssl-dev
で R 上でパッケージをインストールします。
install.packages("shinyjs")
install.packages("jpeg")
install.packages("png")
install.packages("RCurl")

install.packages("remotes")
remotes::install_github("cran/colorspace")
remotes::install_github("clauswilke/colorblindr")
使ってみよう!
cvd_emulator
画像ファイルを指定すると、その画像がどんな風に見えるのかを確認することができます。R 上で以下のようにして起動します。
library(colorblindr)
cvd_emulator()
起動すると以下のようなページが表示されます。 Upload Image の「 Browse 」ボタンをクリックして画像ファイルを指定します。
「 Desaturated 」「 Deuteranope 」等をクリックするとシミュレートできます。以下は「 All 」を選んだ時のスクリーンショットです。

view_cvd
cvd_emulator では画像ファイルを指定しましたが、 view_cvd は R 上で描いたグラフ等をそのまま指定することができます。以下はサンプルです。
library(ggplot2)
library(colorblindr)
sample_data <- data.frame(x=factor(rep(seq(1,10),5)),g=factor(rep(seq(1,5), each=10)),c=round(runif(10*5,10,100)))
p <- ggplot(sample_data, aes(x = `x`, y = `c`,fill=`g`)) +
geom_bar(stat = "identity",color="black",size=0.3) +
scale_fill_manual(values=c("#ff4b00","#fff100","#03af7a","#005aff","#4dc4ff","#ff8082","#f6aa00","#990099","#804000"))
view_cvd(p)
cvd_grid
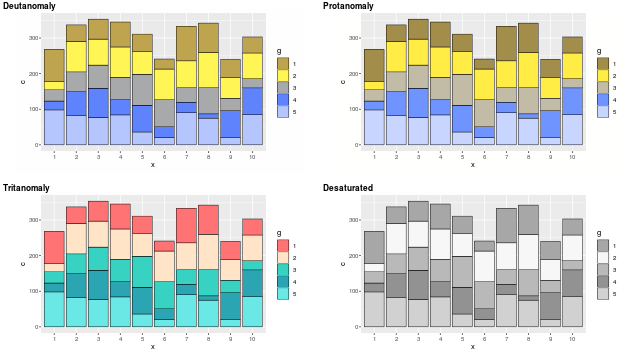
R 上で描いたグラフ等を、まとめて並べて表示することができます。以下はサンプルです。
library(ggplot2)
library(colorblindr)
sample_data <- data.frame(x=factor(rep(seq(1,10),5)),g=factor(rep(seq(1,5), each=10)),c=round(runif(10*5,10,100)))
p <- ggplot(sample_data, aes(x = `x`, y = `c`,fill=`g`)) +
geom_bar(stat = "identity",color="black",size=0.3) +
scale_fill_manual(values=c("#ff854f","#fffe4f","#51cea8","#4f90ff","#87ddff","#ffacad","#ffca4f","#be4fbe","#ac7d4f")) #20x-20
cvd_grid(p)
実行すると以下のような感じで表示できます。
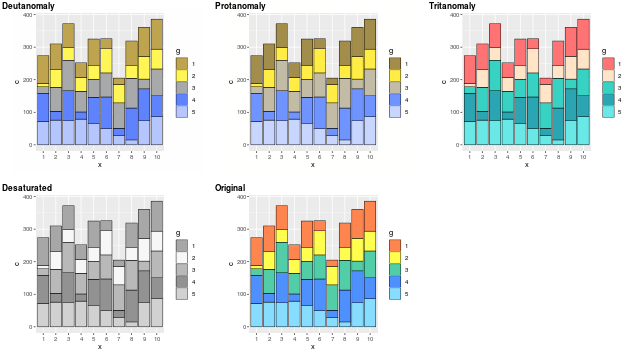
私はオリジナル画像も表示させた方が分かりやすいので、 cvd_grid を以下のように定義しなおしちゃっています。
cvd_grid <- function (plot = last_plot(), severity = 1)
{
    deut <- function(c) deutan(c, severity)
    p1 <- edit_colors(plot, deut)
    prot <- function(c) protan(c, severity)
    p2 <- edit_colors(plot, prot)
    trit <- function(c) tritan(c, severity)
    p3 <- edit_colors(plot, trit)
    des <- function(c) desaturate(c, severity)
    p4 <- edit_colors(plot, des)
    cowplot::plot_grid(p1, p2, p3, p4, plot, scale = 0.9, hjust = 0,
        vjust = 1, labels = c("Deutanomaly", "Protanomaly", "Tritanomaly",
            "Desaturated","Original"), label_x = 0.01, label_y = 0.99, label_size = 12,
        label_fontface = "bold")
}
それを実行してから再度サンプルを実行すると以下のような感じとなります。
以下のように ggsave を使えば結果を画像ファイルとして保存することもできます。
ggsave(plot = p, file = "colors.png", dpi = 100, width = 12.8, height = 7.28)


