全体に透明度を持たせるなら
BaseStyle->Opacity[0.5]
などでOK。
値によって透明度を変化させたいときはColorFunctionのオプションで以下のようにする。例えば値が最小のとき透明で最大のとき不透明なグレースケールは
ColorFunction ->( {Opacity[#],Blend[{White,Black},#]}& )で作れる。
なお()は評価順序の都合のため必要。
例
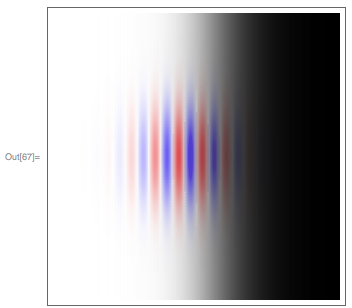
density=DensityPlot[Tanh[x],{x,-3,3},{y,-3,3},
  ColorFunction->({Blend[{White,Black},#],Opacity[#}}&),
  FrameTicks->None,
  PlotPoints->100,
  ImageSize->300
];
wave=DensityPlot[Sin[(2 Pi x)/0.5]*Exp[-x*x-y*y],{x,-3,3},{y,-3,3},
  ColorFunction->(Blend[{Blue,White,Red},#]&),
  FrameTicks->None,
  PlotPoints->100,
  ImageSize->300
];
Overlay[
  {density,wave}
];