コード
plt_row = 3
plt_col = 3
plt_ignore = np.tril(np.array(range(1,plt_row*plt_col+1)).reshape(plt_row,plt_col)).flatten()
counter = 0

plt.figure(figsize=(10,7))
for i_plt in range(1,plt_row*plt_col+1):

    is_right  = (i_plt%plt_col)!=1
    is_left   = (i_plt%plt_col)==1
    is_upper  = i_plt<=(plt_row*plt_col-plt_col)
    is_bottom = i_plt>(plt_row*plt_col-plt_col)

    if plt_ignore[i_plt-1]>0:

        if is_upper&is_right:
            plt.subplot(plt_row,plt_col,i_plt)
            plt.tick_params(bottom=None,labelbottom=None,left=None,labelleft=None)
        elif is_upper:
            plt.subplot(plt_row,plt_col,i_plt)
            plt.tick_params(bottom=None,labelbottom=None)
        elif is_right:
            plt.subplot(plt_row,plt_col,i_plt)
            plt.tick_params(left=None,labelleft=None)
        else:
            plt.subplot(plt_row,plt_col,i_plt)
        if is_left:
            plt.ylabel('a')
        if is_bottom:
            plt.xlabel('a')

        counter += 1

plt.show()
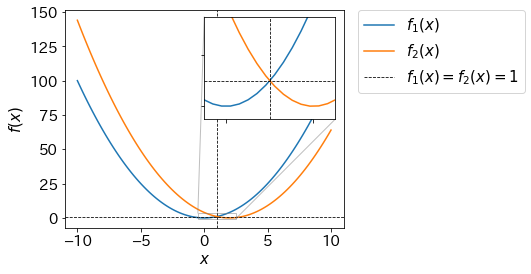
コード
import numpy as np
import matplotlib.pyplot as plt
%matplotlib inline
plt.rcParams['font.size'] = 15

x = np.linspace(-10,10,100)
f1 = x**2
f2 = (x-2)**2

fig, ax = plt.subplots(figsize=[5, 4])

ax.plot(x,f1,label='$f_1(x)$')
ax.plot(x,f2,label='$f_2(x)$')
ax.axvline(1,color='k',ls='dashed',lw=0.8,label='$f_1(x)=f_2(x)=1$')
ax.axhline(1,color='k',ls='dashed',lw=0.8)
ax.set_xlabel('$x$')
ax.set_ylabel('$f(x)$')
plt_legend_out()

axins = ax.inset_axes([0.5, 0.5, 0.47, 0.47])
axins.plot(x,f1)
axins.plot(x,f2)
axins.axvline(1,color='k',ls='dashed',lw=0.8)
axins.axhline(1,color='k',ls='dashed',lw=0.8)
axins.set_xlim(-0.5,2.5)
axins.set_ylim(-0.5,3.5)
axins.set_xticklabels('')
axins.set_yticklabels('')

ax.indicate_inset_zoom(axins)

plt.show()
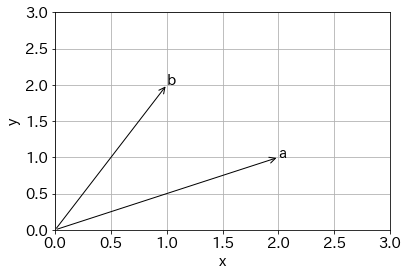
コード
import numpy as np
import matplotlib.pyplot as plt
%matplotlib inline
plt.rcParams['font.size'] = 15

plt.annotate("",xy=(2,1),xytext=(0,0),arrowprops=dict(arrowstyle="->"))
plt.annotate("a",xy=(2,1))
plt.annotate("",xy=(1,2),xytext=(0,0),arrowprops=dict(arrowstyle="->"))
plt.annotate("b",xy=(1,2))
plt.xlim(0,3)
plt.ylim(0,3)
plt.grid()
plt.xlabel('x')
plt.ylabel('y')
plt.show()

コード
import numpy as np
import matplotlib.pyplot as plt
import matplotlib.gridspec as gridspec
%matplotlib inline
plt.rcParams['font.size'] = 15

x = np.random.randn(1000)

gs = gridspec.GridSpec(1, 2, width_ratios=[4,1], height_ratios=[1] ,wspace=0.05)

plt.figure(figsize=(8,3))
plt.subplot(gs[0])
plt.scatter(range(len(x)),x,color='k',s=2)
plt.ylim(-4,4)
plt.xlabel('index')
plt.ylabel('x')
plt.axhline(y=0,color='gray',lw=1)

plt.subplot(gs[1])
plt.hist(x,orientation='horizontal',bins=20,color='k')
plt.tick_params(left=False,labelleft=False)
plt.ylim(-4,4)
plt.xlabel('freq.')
plt.axhline(y=0,color='gray',lw=1)

plt.show()

コード
import numpy as np
import matplotlib as mpl
import matplotlib.pyplot as plt

x = np.linspace(0, 5, 100)
N = 21
cmap = plt.get_cmap('jet',N)

fig = plt.figure(figsize=(8,6))
ax1 = fig.add_axes([0.10,0.10,0.70,0.85])

for i,n in enumerate(np.linspace(0,2,N)):
    y = np.sin(x)*x**n
    ax1.plot(x,y,c=cmap(i))

plt.xlabel('x')
plt.ylabel('y')

norm = mpl.colors.Normalize(vmin=0,vmax=2)
sm = plt.cm.ScalarMappable(cmap=cmap, norm=norm)
sm.set_array([])
plt.colorbar(sm, ticks=np.linspace(0,2,N),
             boundaries=np.arange(-0.05,2.1,.1))


plt.show()

コード
import numpy as np
import matplotlib.pyplot as plt
%matplotlib inline
plt.rcParams['font.size']=15

np.random.seed(1)
plt.figure(figsize=(12,3.5))

ax0 = plt.subplot(121)
ax1 = ax0.twinx()
ax2 = plt.subplot(122)
ax3 = ax2.twinx()

ax1.get_shared_y_axes().join(ax1, ax3)

ax0.plot(np.random.rand(1) * np.random.rand(10),'r')
ax0.grid()
ax1.plot(10*np.random.rand(1) * np.random.rand(10),'b')

ln2 = ax2.plot(3*np.random.rand(1) * np.random.rand(10),'r',label='red')
ax2.grid()
ln3 = ax3.plot(10*np.random.rand(1) * np.random.rand(10),'b',label='blue')

# legend
lns = ln2 + ln3
labs = [l.get_label() for l in lns]
ax3.legend(lns, labs, bbox_to_anchor=(1.1, 1), loc='upper left', borderaxespad=0, )

plt.show()

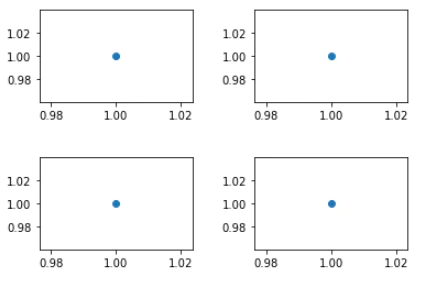
コード
import matplotlib.pyplot as plt
%matplotlib inline

plt.subplots_adjust(wspace=0.4,hspace=0.6)

plt.subplot(2,2,1)
plt.scatter(1,1)

plt.subplot(2,2,2)
plt.scatter(1,1)

plt.subplot(2,2,3)
plt.scatter(1,1)

plt.subplot(2,2,4)
plt.scatter(1,1)
plt.show()

コード
import matplotlib.pyplot as plt
%matplotlib inline

plt.subplots_adjust(wspace=0.15,hspace=0.15)
min = 0.8
max = 1.2

plt.subplot(2,2,1)
plt.scatter(1,1)
plt.tick_params(bottom=False,labelbottom=False)
plt.xlim(min,max)
plt.ylim(min,max)

plt.subplot(2,2,2)
plt.scatter(1,1)
plt.tick_params(bottom=False,labelbottom=False,left=False,labelleft=False)
plt.xlim(min,max)
plt.ylim(min,max)

plt.subplot(2,2,3)
plt.scatter(1,1)
plt.xlim(min,max)
plt.ylim(min,max)

plt.subplot(2,2,4)
plt.scatter(1,1)
plt.tick_params(left=False,labelleft=False)
plt.xlim(min,max)
plt.ylim(min,max)
plt.show()

コード
import numpy as np
import matplotlib.pyplot as plt
import matplotlib.gridspec as gridspec
%matplotlib inline
plt.rcParams['font.size'] = 15

def r2(y1, y2):
    r2 = str(np.round(np.corrcoef(y1, y2)[0,1],3))
    return r2

xa_train = [1,3,5,7]
xa_test  = [2,4,6,9]
ya_train = xa_train + np.random.randn(4)
ya_test  = xa_test  + np.random.randn(4)

xb_train = [1,3,5,7]
xb_test  = [2,4,6,9]
yb_train = xb_train + np.random.randn(4)
yb_test  = xb_test  + np.random.randn(4)

plt.figure()
plt.subplots_adjust(wspace=0.2, hspace=0.4)

gs = gridspec.GridSpec(2, 2, width_ratios=[1,1], height_ratios=[4,1])

plt.subplot(gs[0])
plt.scatter(xa_train, ya_train, color='k', label='train')
plt.scatter(xa_test, ya_test, color='r', label='test')
plt.xlim(0,10)
plt.ylim(0,10)
plt.xticks([0,2,4,6,8,10])
plt.yticks([0,2,4,6,8,10])
plt.plot([0,10],[0,10], color='gray', lw=0.5)
plt.grid()
plt.title('train')
plt.xlabel('measured')
plt.ylabel('predicted')

plt.subplot(gs[1])
plt.scatter(xb_train, yb_train, color='k',label='train')
plt.scatter(xb_test, yb_test, color='r', label='test')
plt.xlim(0,10)
plt.ylim(0,10)
plt.xticks([0,2,4,6,8,10])
plt.yticks([0,2,4,6,8,10])
plt.plot([0,0],[10,10])
plt.plot([0,10],[0,10], color='gray', lw=0.5)
plt.grid()
plt.title('test')
plt.xlabel('measured')
plt.tick_params(left=False,labelleft=False)
plt.legend(bbox_to_anchor=(1.05, 1), loc='upper left', borderaxespad=0)

plt.subplot(gs[2])
plt.tick_params(left=False, labelleft=False,bottom=False, labelbottom=False)
for i in ['top','bottom','left','right'] : plt.gca().spines[i].set_visible(False)
plt.scatter(0,0,label='$R^2_{train}=$'+r2(xa_train,ya_train)+'\n$R^2_{test}=$'+r2(xa_test,ya_test),alpha=0)
plt.legend(frameon=False, loc='upper left')

plt.subplot(gs[3])
plt.tick_params(left=False, labelleft=False,bottom=False, labelbottom=False)
for i in ['top','bottom','left','right'] : plt.gca().spines[i].set_visible(False)
plt.scatter(0,0,label='$R^2_{train}=$'+r2(xb_train,yb_train)+'\n$R^2_{test}=$'+r2(xb_test,yb_test),alpha=0)
plt.legend(frameon=False, loc='upper left')

plt.show()

