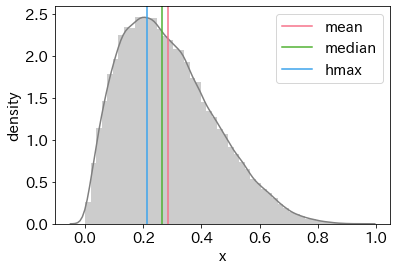
meanでもmedianでもなくhmaxを取得したい時がある。
関数
def hmax(x, bins=20):
    import numpy as np
    hist, bins = np.histogram(x, density=True, bins=20)
    delta = (bins[1]-bins[0])/2
    xr = np.linspace(np.min(bins)+delta,np.max(bins)-delta,len(bins)-1)
    return xr[np.argmax(hist)]
プロット
import matplotlib.pyplot as plt
import numpy as np
import seaborn as sns
%matplotlib inline
plt.rcParams['font.size']=15

x = np.random.beta(2,5,100000)
df_plot = pd.DataFrame(fit.extract()['mu'])
c = sns.color_palette('husl',3)
sns.distplot(x,color='gray')
plt.axvline(x=np.mean(x),label='mean',color=c[0])
plt.axvline(x=np.median(x),label='median',color=c[1])
plt.axvline(hmax(x),label='hmax',color=c[2])
plt.legend()
plt.show()