Reference
Preparation
import numpy as np
import pandas as pd
import matplotlib.pyplot as plt
import seaborn as sns
%matplotlib inline
plt.rcParams['font.size']=15

def plt_legend_out(frameon=True):
    plt.legend(bbox_to_anchor=(1.05, 1), loc='upper left', borderaxespad=0, frameon=frameon)
import lightgbm as lgb
Data
np.random.seed(0)
num_data = 100
x1 = np.random.randn(num_data)
x2 = np.abs(np.random.randn(num_data))
y = x1 + x2**2*2
df = pd.DataFrame({'x1':x1,'x2':x2,'y':y})
# df = df.sort_values('y',ascending=True).reset_index(drop=True)
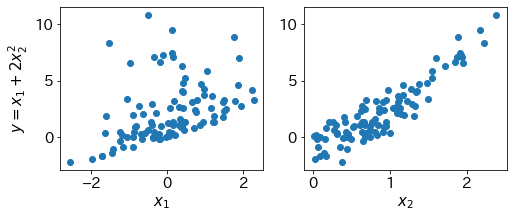
plt.figure(figsize=(8,3))
plt.subplot(1,2,1)
plt.scatter(df['x1'],df['y'])
plt.xlabel('$x_1$')
plt.ylabel('$y = x_1+2x_2^2$')
plt.subplot(1,2,2)
plt.scatter(df['x2'],df['y'])
plt.xlabel('$x_2$')
plt.show()
CV
test_ratio = 0.3
idx = int(df.shape[0]*(1-test_ratio))
idx_tr = np.arange(0,idx,1)
idx_te = np.arange((idx),df.shape[0],1)
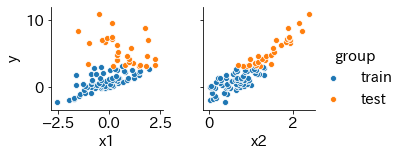
df['group'] = 'train'
df.loc[idx_te,'group'] = 'test'
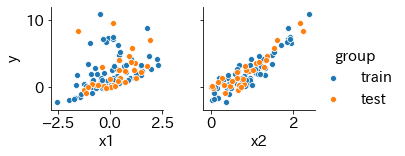
sns.pairplot(data=df,x_vars=['x1','x2'],y_vars=['y'],hue='group')
plt.show()
X_tr = df.loc[df['group']=='train',['x1','x2']]
X_te = df.loc[df['group']=='test' ,['x1','x2']]
y_tr = df.loc[df['group']=='train',['y']]
y_te = df.loc[df['group']=='test' ,['y']]
lgb_tr = lgb.Dataset(X_tr, y_tr)
lgb_te = lgb.Dataset(X_te, y_te)
params = {'metric': 'rmse',
          'max_depth' : 20}
>>> gbm = lgb.train(params,
                    lgb_tr,
                    valid_sets=lgb_te,
                    num_boost_round=10000,
                    early_stopping_rounds=100,
                    verbose_eval=50)
Training until validation scores don't improve for 100 rounds
[50]	valid_0's rmse: 1.4018
[100]	valid_0's rmse: 1.41973
[150]	valid_0's rmse: 1.42974
Early stopping, best iteration is:
[56]	valid_0's rmse: 1.39998
y_te_pr = gbm.predict(X_te, num_iteration=gbm.best_iteration)
y_tr_pr = gbm.predict(X_tr, num_iteration=gbm.best_iteration)
df['y_pr'] = np.concatenate([gbm.predict(X_tr),gbm.predict(X_te)])
max = df[['y','y_pr']].max().max()+1
min = df[['y','y_pr']].min().min()-1
from sklearn.metrics import r2_score
r2 = r2_score(df.loc[df['group']=='test','y'],df.loc[df['group']=='test','y_pr'])

from sklearn.metrics import mean_absolute_error
rmse = np.sqrt(mean_absolute_error(df.loc[df['group']=='test','y'],df.loc[df['group']=='test','y_pr']))
>>> print('R2  ',r2)
R2   0.709308344489474
>>> print('RMSE',rmse)
RMSE 0.9061783237262847
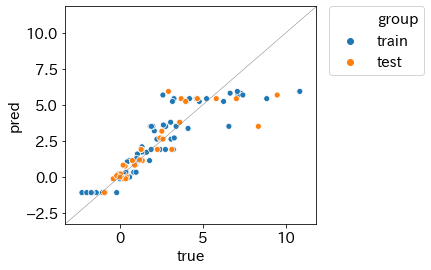
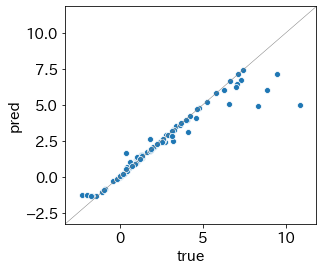
plt.figure(figsize=(4.5,4))
sns.scatterplot(data=df,x='y',y='y_pr',hue='group')
plt.plot([min,max],[min,max],color='gray',lw=0.5)
plt.xlabel('true')
plt.ylabel('pred')
plt_legend_out()
plt.xlim(min,max)
plt.ylim(min,max)
plt.show()
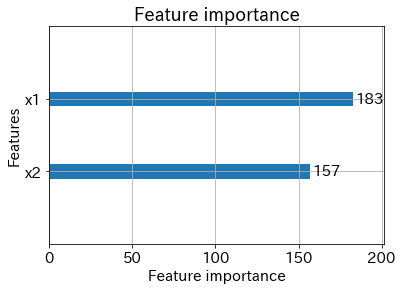
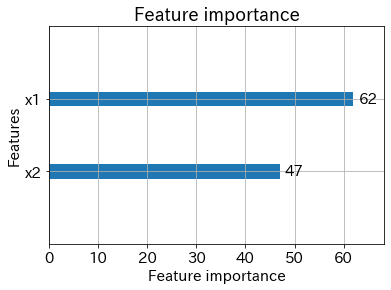
lgb.plot_importance(gbm)
plt.show()
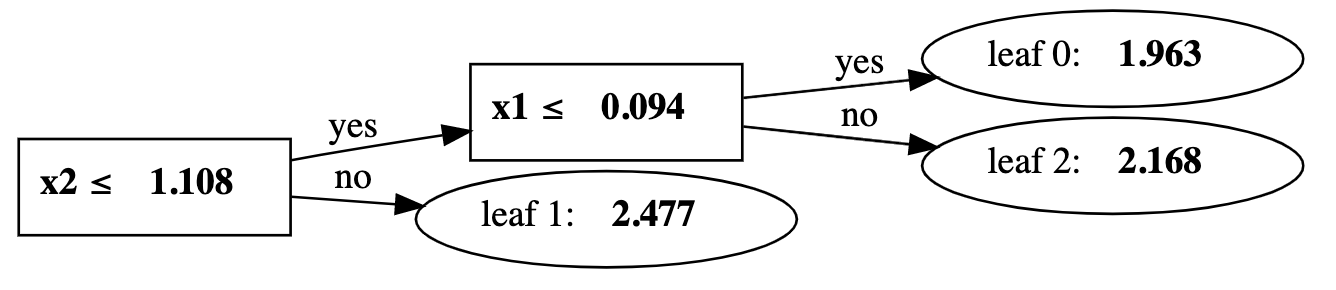
lgb.create_tree_digraph(gbm)
LOO
from sklearn.model_selection import LeaveOneOut
loo = LeaveOneOut()
loo.get_n_splits(df)
l_pred = []

for train_index, test_index in loo.split(df):
    train_set = lgb.Dataset(df.loc[train_index, ['x1','x2']], df.loc[train_index,'y'])
    test_set  = lgb.Dataset(df.loc[test_index , ['x1','x2']], df.loc[test_index ,'y'])

    gbm = lgb.train(params,
                 train_set=train_set,
                 valid_sets=test_set,
             num_boost_round=10000,
             early_stopping_rounds=100,
                                verbose_eval=None)
    l_pred.append(gbm.predict(df.loc[test_index , ['x1','x2']], num_iteration=gbm.best_iteration)[0])
df['y_pr'] = l_pred
max = df[['y','y_pr']].max().max()+1
min = df[['y','y_pr']].min().min()-1
from sklearn.metrics import r2_score
r2 = r2_score(df.loc[df['group']=='test','y'],df.loc[df['group']=='test','y_pr'])

from sklearn.metrics import mean_absolute_error
rmse = np.sqrt(mean_absolute_error(df.loc[df['group']=='test','y'],df.loc[df['group']=='test','y_pr']))
>>> print('R2  ',r2)
R2   0.910371740724394
>>> print('RMSE',rmse)
RMSE 0.5066720619208189
plt.figure(figsize=(4.5,4))
sns.scatterplot(data=df,x='y',y='y_pr')
plt.plot([min,max],[min,max],color='gray',lw=0.5)
plt.xlabel('true')
plt.ylabel('pred')
plt.xlim(min,max)
plt.ylim(min,max)
plt.show()
HO
np.random.seed(0)
num_data = 100
x1 = np.random.randn(num_data)
x2 = np.abs(np.random.randn(num_data))
y = x1 + x2**2*2
df = pd.DataFrame({'x1':x1,'x2':x2,'y':y})
df = df.sort_values('y',ascending=True).reset_index(drop=True)

test_ratio = 0.3
idx = int(df.shape[0]*(1-test_ratio))
idx_tr = np.arange(0,idx,1)
idx_te = np.arange((idx),df.shape[0],1)
df['group'] = 'train'

df.loc[idx_te,'group'] = 'test'
sns.pairplot(data=df,x_vars=['x1','x2'],y_vars=['y'],hue='group')
plt.show()
X_tr = df.loc[df['group']=='train',['x1','x2']]
X_te = df.loc[df['group']=='test' ,['x1','x2']]
y_tr = df.loc[df['group']=='train',['y']]
y_te = df.loc[df['group']=='test' ,['y']]
lgb_tr = lgb.Dataset(X_tr, y_tr)
lgb_te = lgb.Dataset(X_te, y_te)
params = {'metric': 'rmse',
          'max_depth' : 20}
evaluation_results = {}

gbm = lgb.train(params,
                lgb_tr,
                valid_sets=lgb_te,
                num_boost_round=10000,
                early_stopping_rounds=100,
                verbose_eval=50)
y_te_pr = gbm.predict(X_te, num_iteration=gbm.best_iteration)
y_tr_pr = gbm.predict(X_tr, num_iteration=gbm.best_iteration)
df['y_pr'] = np.concatenate([gbm.predict(X_tr),gbm.predict(X_te)])
max = df[['y','y_pr']].max().max()+1
min = df[['y','y_pr']].min().min()-1
from sklearn.metrics import r2_score
r2 = r2_score(df.loc[df['group']=='test','y'],df.loc[df['group']=='test','y_pr'])

from sklearn.metrics import mean_absolute_error
rmse = np.sqrt(mean_absolute_error(df.loc[df['group']=='test','y'],df.loc[df['group']=='test','y_pr']))
>>> print('R2  ',r2)
R2   -2.49183125003491
>>> print('RMSE',rmse)
RMSE 1.7911107004894555
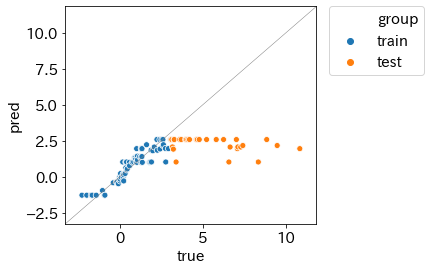
plt.figure(figsize=(4.5,4))
sns.scatterplot(data=df,x='y',y='y_pr',hue='group')
plt.plot([min,max],[min,max],color='gray',lw=0.5)
plt.xlabel('true')
plt.ylabel('pred')
plt_legend_out()
plt.xlim(min,max)
plt.ylim(min,max)
plt.show()
lgb.plot_importance(gbm)
plt.show()