Reference
- https://medium.com/micin-developers/decipher-github-lr-sw-40e519a13c0a
- https://jp.mathworks.com/help/curvefit/least-squares-fitting.html#bq_5kr9-3
- https://www.mathworks.com/help/curvefit/least-squares-fitting.html#bq_5kr9-3
Preparation
import numpy as np
import pandas as pd
import matplotlib.pyplot as plt
import seaborn as sns
%matplotlib inline
plt.rcParams['font.size']=15

def plt_legend_out(frameon=True):
    plt.legend(bbox_to_anchor=(1.05, 1), loc='upper left', borderaxespad=0, frameon=frameon)
from sklearn.linear_model import LinearRegression
OLS
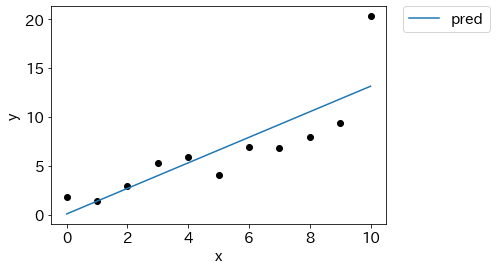
ここでは、以下のデータを想定します。x=10の外れているデータ点を「外れ値」とみなすか、否かで対処が異なってきます。Ordinal Least Squaresモデルで無視するケース(WSL1)と組み込むケース(WSL2)を考えます。OLSですと、以下の通りx=10の点に引っ張られた回帰直線になります。
n = 11
x = np.arange(0,n,1)

np.random.seed(0)
y = x + np.random.randn(n)
y[len(y)-1] = y[len(y)-1]*2

plt.scatter(x,y,color='k')
plt.xlabel('x')
plt.ylabel('y')

reg = LinearRegression().fit(x.reshape(-1,1),y)
y_pr1 = reg.predict(x.reshape(-1,1))

plt.plot(x,y_pr1,label='pred')
plt_legend_out()
plt.show()
WLS1
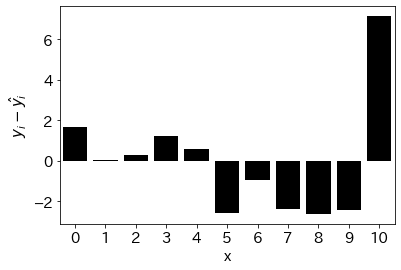
x=10の点を「外れ値」とみなして、処理を進めます。まずは、残差を取ります。
diff = y - y_pr1
df_plot = pd.DataFrame({'x':x,'error':diff})
sns.barplot(data=df_plot,x='x',y='error',color='k')
plt.ylabel('$y_i-\hat{y_i}$')
plt.show()
(略)
sw = (np.max(np.abs(diff)) - np.abs(diff))**2
df_plot = pd.DataFrame({'x':x,'error':sw})
sns.barplot(data=df_plot,x='x',y='error',color='k')
plt.ylabel('$(argmax|y_i-\hat{y_i}|-|y_i-\hat{y_i}|)^2$')
plt.show()

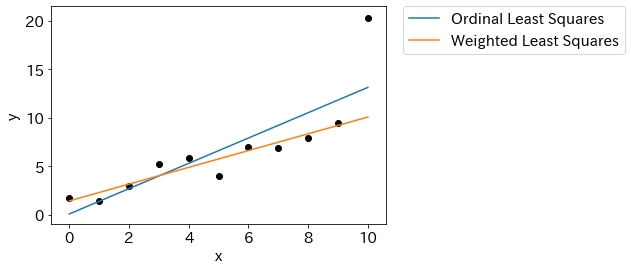
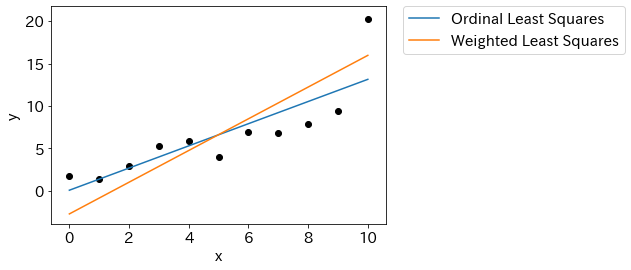
上記のsample weightをOrdinal Least Squaresに組み込みます。x=10の点を無視した回帰直線となりました。
reg.fit(x.reshape(-1,1),y, sample_weight=sw)
y_pr2 = reg.predict(x.reshape(-1,1))
plt.plot(x,y_pr1,label='Ordinal Least Squares')
plt.plot(x,y_pr2,label='Weighted Least Squares')
plt_legend_out()
plt.scatter(x,y,color='k')
plt.xlabel('x')
plt.ylabel('y')
plt.show()
plt.figure(figsize=(10,4))
plt.subplots_adjust(wspace=0.4)
min = np.min(np.concatenate([y,y_pr1,y_pr2]))-1
max = np.max(np.concatenate([y,y_pr1,y_pr2]))+1
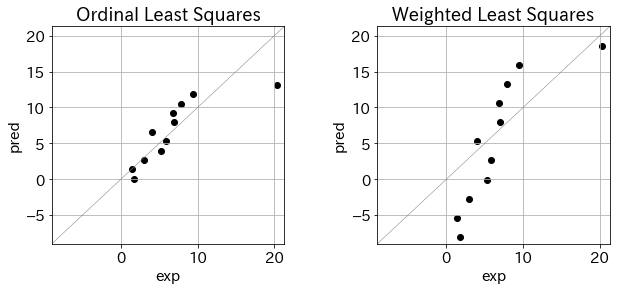
plt.subplot(1,2,1)
plt.scatter(y,y_pr1,color='k')
plt.plot([min,max],[min,max],color='gray',lw=0.5)
plt.xlabel('exp')
plt.ylabel('pred')
plt.grid()
plt.xlim(min,max)
plt.ylim(min,max)
plt.title('Ordinal Least Squares')
plt.subplot(1,2,2)
plt.scatter(y,y_pr2,color='k')
plt.plot([min,max],[min,max],color='gray',lw=0.5)
plt.xlabel('exp')
plt.ylabel('pred')
plt.grid()
plt.xlim(min,max)
plt.ylim(min,max)
plt.title('Weighted Least Squares')
plt.show()

WLS2
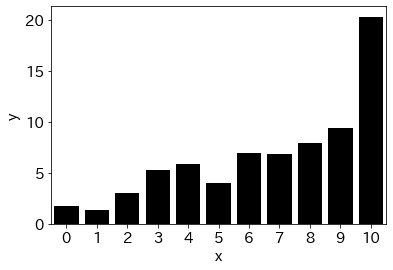
x=10の点を過剰にフィットさせたいケースを考えます。
df_plot = pd.DataFrame({'x':x,'y':y})
sns.barplot(data=df_plot,x='x',y='y',color='k')
plt.show()
reg.fit(x.reshape(-1,1),y, sample_weight=1/y)
y_pr2 = reg.predict(x.reshape(-1,1))
plt.plot(x,y_pr1,label='Ordinal Least Squares')
plt.plot(x,y_pr2,label='Weighted Least Squares')
plt_legend_out()
plt.scatter(x,y,color='k')
plt.xlabel('x')
plt.ylabel('y')
plt.show()
plt.figure(figsize=(10,4))
plt.subplots_adjust(wspace=0.4)

min = np.min(np.concatenate([y,y_pr1,y_pr2]))-1
max = np.max(np.concatenate([y,y_pr1,y_pr2]))+1

plt.subplot(1,2,1)
plt.scatter(y,y_pr1,color='k')
plt.plot([min,max],[min,max],color='gray',lw=0.5)
plt.xlabel('exp')
plt.ylabel('pred')
plt.grid()
plt.xlim(min,max)
plt.ylim(min,max)
plt.title('Ordinal Least Squares')

plt.subplot(1,2,2)
plt.scatter(y,y_pr2,color='k')
plt.plot([min,max],[min,max],color='gray',lw=0.5)
plt.xlabel('exp')
plt.ylabel('pred')
plt.grid()
plt.xlim(min,max)
plt.ylim(min,max)
plt.title('Weighted Least Squares')
plt.show()

さらにWeightを強く掛けます。
diff = y - y_pr1
df_plot = pd.DataFrame({'x':x,'error':np.abs(diff)*y})
sns.barplot(data=df_plot,x='x',y='error',color='k')
plt.ylabel('$y_i\cdot|y_i-\hat{y_i}|$')
plt.show()
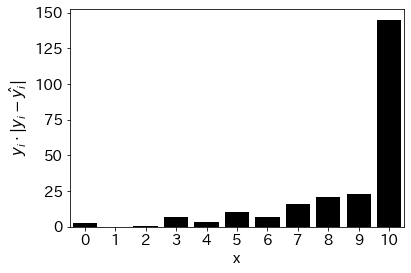
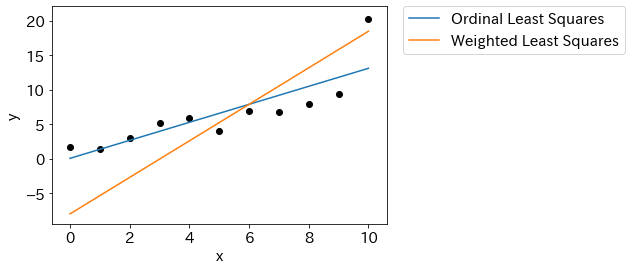
reg.fit(x.reshape(-1,1),y, sample_weight=np.abs(diff)*y)
y_pr2 = reg.predict(x.reshape(-1,1))
plt.plot(x,y_pr1,label='Ordinal Least Squares')
plt.plot(x,y_pr2,label='Weighted Least Squares')
plt_legend_out()
plt.scatter(x,y,color='k')
plt.xlabel('x')
plt.ylabel('y')
plt.show()
plt.figure(figsize=(10,4))
plt.subplots_adjust(wspace=0.4)

min = np.min(np.concatenate([y,y_pr1,y_pr2]))-1
max = np.max(np.concatenate([y,y_pr1,y_pr2]))+1

plt.subplot(1,2,1)
plt.scatter(y,y_pr1,color='k')
plt.plot([min,max],[min,max],color='gray',lw=0.5)
plt.xlabel('exp')
plt.ylabel('pred')
plt.grid()
plt.xlim(min,max)
plt.ylim(min,max)
plt.title('Ordinal Least Squares')

plt.subplot(1,2,2)
plt.scatter(y,y_pr2,color='k')
plt.plot([min,max],[min,max],color='gray',lw=0.5)
plt.xlabel('exp')
plt.ylabel('pred')
plt.grid()
plt.xlim(min,max)
plt.ylim(min,max)
plt.title('Weighted Least Squares')
plt.show()
その他
>>> reg.predict(np.array(30).reshape(-1,1))
array([71.52016456])