KPIを折れ線グラフ化するのに使ったので、使い方を忘れないようにメモっておきます。
導入
nvd3のjsとcssをgithubから落としてきて、プロジェクトのディレクトリにコピー。
【github】
https://github.com/novus/nvd3.git
$ git clone https://github.com/novus/nvd3.git

$ cp ./nvd3/build/nv.d3.min.js /path/to/application/js/dir/

$ cp ./nvd3/build/nv.d3.min.css /path/to/application/css/dir/
d3.jsを落としてきて、プロジェクトのディレクトリにコピー
【github】
https://github.com/mbostock/d3/releases/download/v3.5.14/d3.zip
$ wget https://github.com/mbostock/d3/releases/download/v3.5.14/d3.zip

$ unzip ./d3.zip

$ cp d3.min.js /path/to/application/js/dir/
HTML側
HTMLファイルに以下を追記
(ライブラリのロードと、描画領域の指定)
<head>
  <link media="all" type="text/css" rel="stylesheet" href="https://hogehoge.jp/css/nv.d3.min.css">
</head>

<body>
  <!-- contents -->

  <!-- /contents -->

  <!-- chart/ここがグラフ描画領域 -->
  <div id="chart-container" style="height: 500px;">
    <svg></svg>
  </div>
  <!-- /chart -->

  <script src="https://hogehoge.jp/js/lib/d3.min.js"></script>
  <script src="https://hogehoge.jp/js/lib/nv.d3.min.js"></script>
</body>
javascript側
jQueryのreadyタイミングでグラフを描画させる感じにする。
データはajaxで取得
$(function() {
$.ajax({
url: '/chart_data/'
})
.done(function(data) {
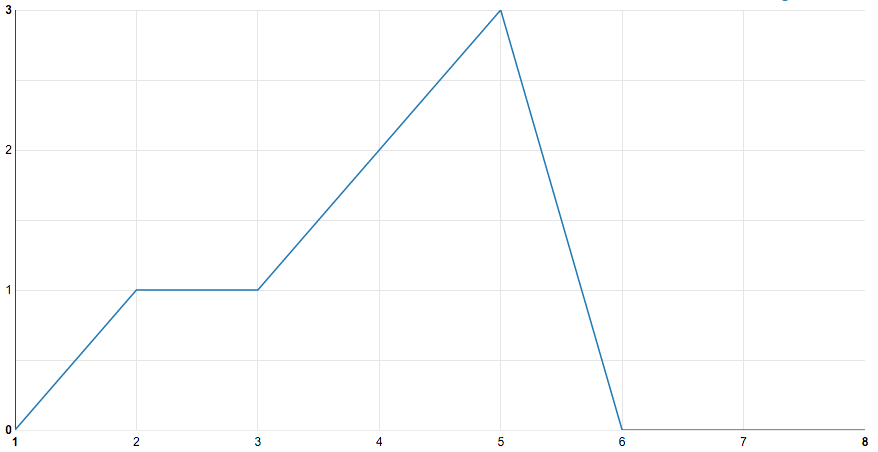
// データの内容はこんな感じで返ってくる
// data = [
// {x: 1, y: 0},
// {x: 2, y: 1},
// {x: 3, y: 1},
// {x: 4, y: 2},
// {x: 5, y: 3},
// {x: 6, y: 0},
// {x: 7, y: 0},
// {x: 8, y: 0},
// ];
nv.addGraph(function() {
// グラフオブジェクト生成
var chart = nv.models.lineChart()
.useInteractiveGuideline(true)
.showLegend(true)
.showYAxis(true)
.showXAxis(true);
// x軸のタイトル設定+フォーマット指定(数値指定)
chart.xAxis.axisLabel('x-data').tickFormat(d3.format('d'));
// y軸のタイトル設定+フォーマット指定(数値指定)
chart.xAxis.axisLabel('y-data').tickFormat(d3.format('d'));
// 戻り値データをd3に渡せる形式に整形
var chartData = [
{
values: data,
key: 'sample data',
// 必要あれば色も指定可能
// color: '#cf3cd0',
},
// 複数のグラフを表示したければ、上と同じ感じでどんどん追記
];
// 描画先のhtmlオブジェクトを指定して変数登録
d3.select("#chart-container svg")
.datum(chartData)
.transition()
.duration(300)
.call(chart);
// リサイズ時更新設定
nv.utils.windowResize(chart.update);
return chart;
});
})
.fail(function(data) {
// エラー処理があれば
});
});
結果
こんな感じで描画される*(^o^)/*