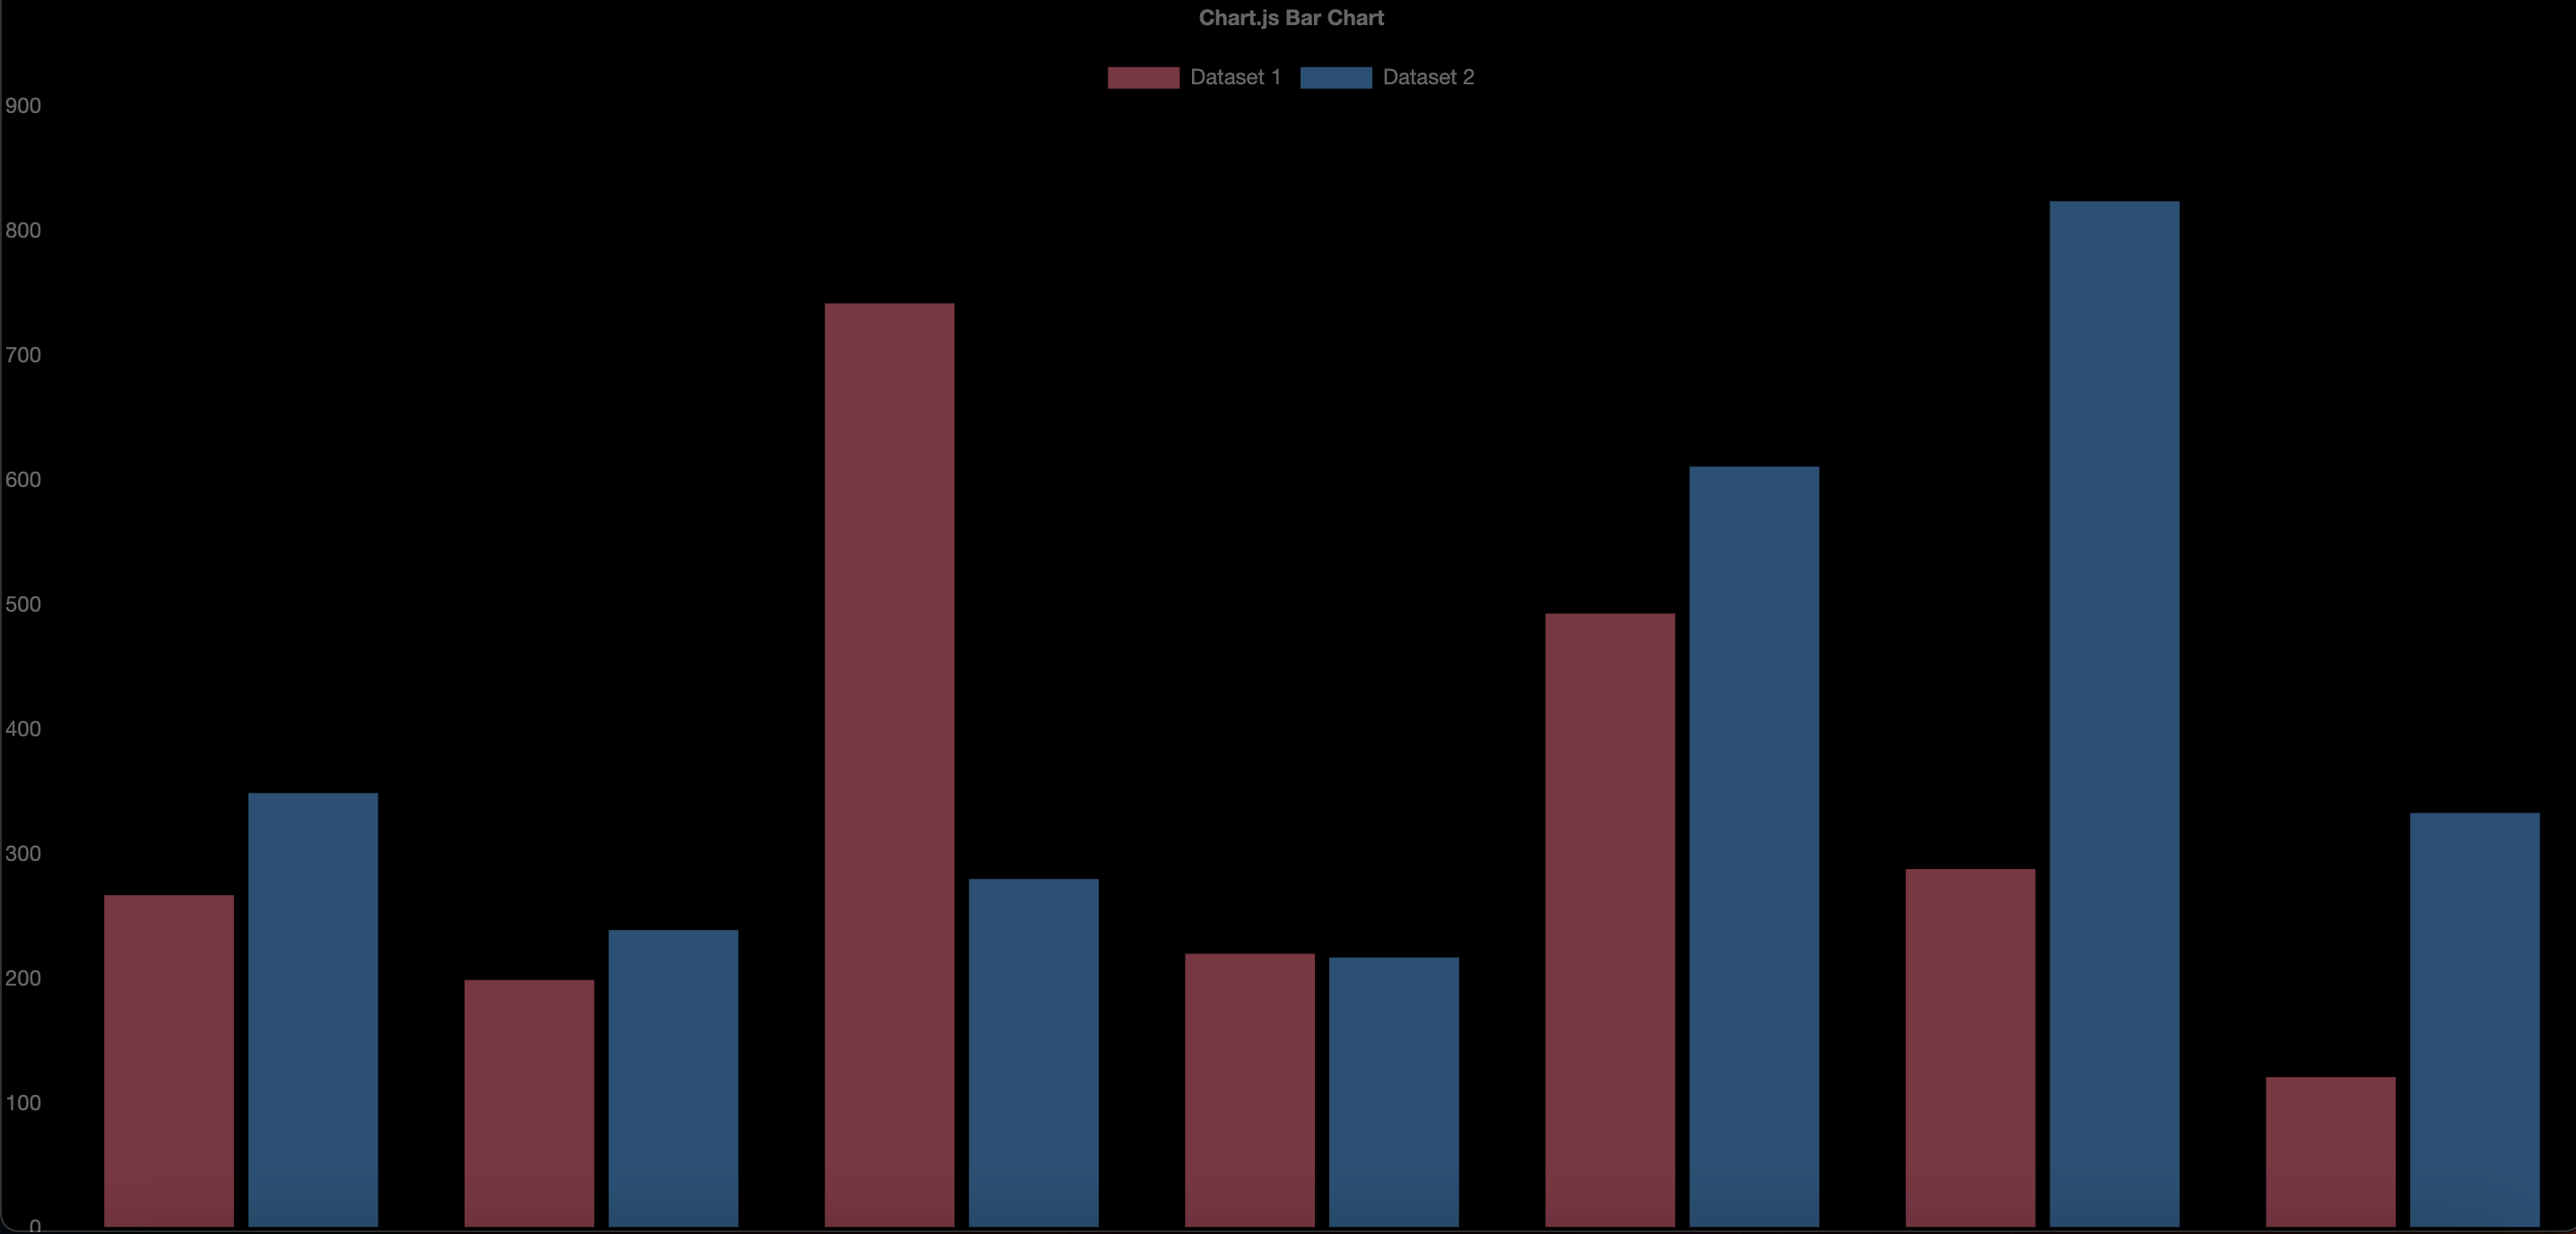
Next.js, TypeScript x react-chartjs-2を使ってグラフを実装します。
画像のような完成イメージです。

環境
next 13.2.4
react 18.2.0
react-chartjs-2 5.2.0
chart.js 4.2.1
typescript 5.0.2
準備
必要なライブラリをインストールします。
npm install chart.js
npm install react-chartjs-2
fakerはダミーデータ生成のために使います。
npm install --save-dev @faker-js/faker
chart.js初期設定
今回の作業はpages/index.tsxで完結させようと思います。
必要なパーツをchart.jsから読み込み、登録します。
pages/index.tsx
import {
  Chart as ChartJS,
  CategoryScale,
  LinearScale,
  BarElement,
  Title,
  Tooltip,
  Legend,
} from 'chart.js';
import { Bar } from 'react-chartjs-2';
import { faker } from '@faker-js/faker'

ChartJS.register(
  CategoryScale,
  LinearScale,
  BarElement,
  Title,
  Tooltip,
  Legend
);

...
グラフ表示
オプション、ラベル、グラフに表示するデータを準備してBarコンポーネントに渡してあげます。
全体のソースコードはこちらです。
pages/index.tsx
import {
  Chart as ChartJS,
  CategoryScale,
  LinearScale,
  BarElement,
  Title,
  Tooltip,
  Legend,
} from 'chart.js';
import { Bar } from 'react-chartjs-2';
import { faker } from '@faker-js/faker'

ChartJS.register(
  CategoryScale,
  LinearScale,
  BarElement,
  Title,
  Tooltip,
  Legend
);

export default function Home() {
  const options = {
    responsive: true,
    plugins: {
      legend: {
        position: 'top' as const,
      },
      title: {
        display: true,
        text: 'Chart.js Bar Chart',
      },
    },
  }
  const labels = ['January', 'February', 'March', 'April', 'May', 'June', 'July'];

  const data = {
    labels,
    datasets: [
      {
        label: 'Dataset 1',
        data: labels.map(() => faker.datatype.number({ min: 0, max: 1000 })),
        backgroundColor: 'rgba(255, 99, 132, 0.5)',
      },
      {
        label: 'Dataset 2',
        data: labels.map(() => faker.datatype.number({ min: 0, max: 1000 })),
        backgroundColor: 'rgba(53, 162, 235, 0.5)',
      },
    ],
  };
  return (
    <Bar options={options} data={data} />
  )
}