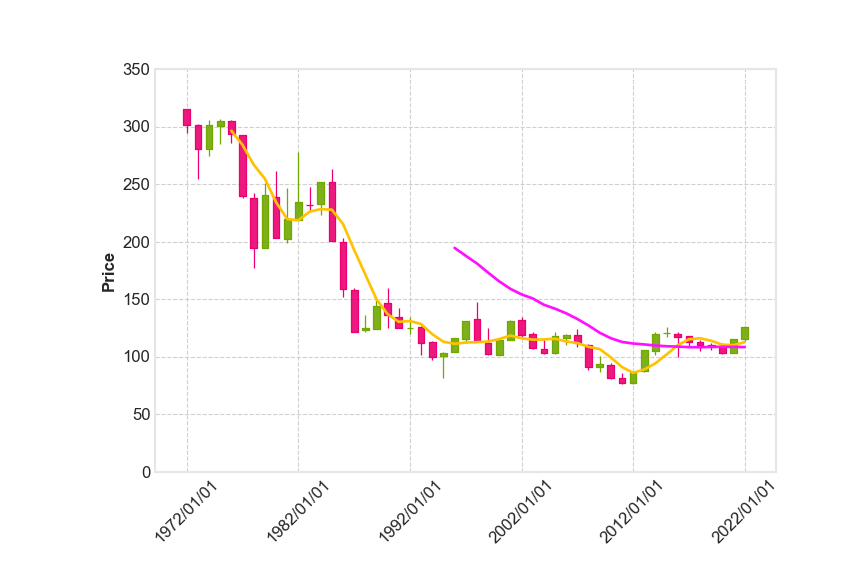
Pythonを使って以下のようなローソク足チャートを描画することができる。最近は円安が話題なので、このエントリではやや見慣れないドル円(USDJPY)の「年足」を描画してみよう。
今回用いる「mplfinance」は金融系の画像操作に特化したライブラリで、pip install mplfinance で導入できる。
ドル円の価格データ USDJPY_1972_2022.csv をpandasデータフレームとして読み込みmplfinanceのplot関数に渡す。(csvの中身は後で示す)
candlestick.py
import pandas as pd
import mplfinance as mpf

df = pd.read_csv('USDJPY_1972_2022.csv',
                 index_col=0, parse_dates=True)
mpf.plot(df, type='candle', datetime_format='%Y/%m/%d', ylim=((0, 350)), figratio=(12, 8), mav=(5, 25), style='binance',
         savefig='candlestick_USDJPY_1972_2022.png')
デフォルトではバー表示だが、type引数で "candle" を指定するとローソク足表示になる。datetime_formatで横軸ラベルのフォーマットを、ylimでy軸(この場合は価格)の範囲を、figratioで出力画像のアスペクト比をそれぞれ指定できる。
mplfinanceはラベル名を大文字小文字で区別するので、頭文字が小文字の場合は
df.columns = ['Open', 'High', 'Low', 'Close']
のようにしてcolumnの名前を変換しておく必要がある。また、四本値の並びは必ずこの順でなければならないので注意。
candlestickのstyleには幾つか種類があるので、気に入ったものを選べば良い。(参考:Python mplfinanceのcandlestickのstyleの巻)
mav=(5, 25)は5期間平均線と25期間平均線を表示するという意味。整数値のみ指定可能で、何本でも表示できる。
savefigで保存先のパスを指定する。
四本値はmacrotrendsのページから取得した。
csv の中身は以下の通り。date 列データは便宜上1月1日に指定している。
USDJPY_1972_2022.csv
,Open,High,Low,Close
1972-01-01,314.86,314.96,294.12,301.66
1973-01-01,301.39,302.57,254.45,280.27
1974-01-01,280.82,305.34,274.42,301.02
1975-01-01,300.66,306.84,284.66,305.16
1976-01-01,305.06,306.00,286.04,293.08
1977-01-01,292.48,292.91,237.81,239.98
1978-01-01,237.59,242.42,177.05,194.30
1979-01-01,194.58,250.85,194.58,240.30
1980-01-01,238.45,261.40,203.10,203.10
1981-01-01,202.50,246.10,199.05,219.80
1982-01-01,218.75,277.65,218.75,234.70
1983-01-01,232.00,247.05,226.75,231.70
1984-01-01,232.45,251.60,222.70,251.60
1985-01-01,251.80,262.80,200.25,200.25
1986-01-01,199.15,202.70,152.00,158.30
1987-01-01,158.25,159.40,121.25,121.25
1988-01-01,122.70,136.52,121.10,125.05
1989-01-01,123.60,149.62,123.60,143.80
1990-01-01,146.25,159.90,125.05,135.75
1991-01-01,134.60,141.90,124.90,124.90
1992-01-01,124.50,134.53,119.35,124.85
1993-01-01,125.40,126.10,101.10,111.70
1994-01-01,112.50,113.10, 96.77, 99.60
1995-01-01,100.52,104.20, 81.12,103.28
1996-01-01,103.92,116.13,103.92,115.77
1997-01-01,115.49,131.08,111.42,130.45
1998-01-01,132.40,147.14,113.08,113.08
1999-01-01,112.15,124.45,101.53,102.16
2000-01-01,101.70,114.62,101.70,114.35
2001-01-01,114.73,131.47,114.26,131.04
2002-01-01,132.02,134.77,115.71,118.75
2003-01-01,119.86,121.42,106.93,107.13
2004-01-01,106.95,114.30,102.56,102.68
2005-01-01,102.83,120.93,102.26,117.88
2006-01-01,116.34,119.81,110.07,119.02
2007-01-01,118.83,124.09,108.17,111.71
2008-01-01,109.70,110.48, 87.84, 90.79
2009-01-01, 91.12,100.71, 86.12, 93.08
2010-01-01, 92.55, 94.68, 80.48, 81.67
2011-01-01, 81.56, 85.26, 75.72, 76.98
2012-01-01, 76.67, 86.64, 76.11, 86.64
2013-01-01, 87.10,105.25, 86.92,105.25
2014-01-01,104.84,121.38,101.11,119.85
2015-01-01,120.20,125.58,116.78,120.27
2016-01-01,119.30,121.06, 99.89,116.96
2017-01-01,117.55,117.75,107.84,112.69
2018-01-01,112.63,114.44,104.73,109.66
2019-01-01,109.69,112.08,105.28,108.68
2020-01-01,108.69,112.06,102.37,103.25
2021-01-01,103.24,115.42,102.72,115.11
2022-01-01,115.11,126.22,113.67,125.55