大学でgnuplotを使ってグラフを作成する機会があったので、自分用に基本的なgnuplotの使い方をメモっておいたほうがいいと思ったので記録します。
gnuplotとは?
gnuplotは、2次元もしくは3次元のグラフを作成するためのアプリケーションソフトウェアである。よく大学のレポートで使われている。
gnuplotのインストール
gnuplotはWindows,Mac,Linuxなどで使うことができる。
下記のサイトが参考になるので一応、載せておきます。
gnuplotで簡単なグラフを作ってみる
gnuplotを起動させる
sugiyoshi% gnuplot

	G N U P L O T
	Version 5.2 patchlevel 6    last modified 2019-01-01

	Copyright (C) 1986-1993, 1998, 2004, 2007-2018
	Thomas Williams, Colin Kelley and many others

	gnuplot home:     http://www.gnuplot.info
	faq, bugs, etc:   type "help FAQ"
	immediate help:   type "help"  (plot window: hit 'h')

Terminal type is now 'qt'
gnuplot>
起動している間はずっとgnuplot>が先頭に表示される。
関数からグラフを作る
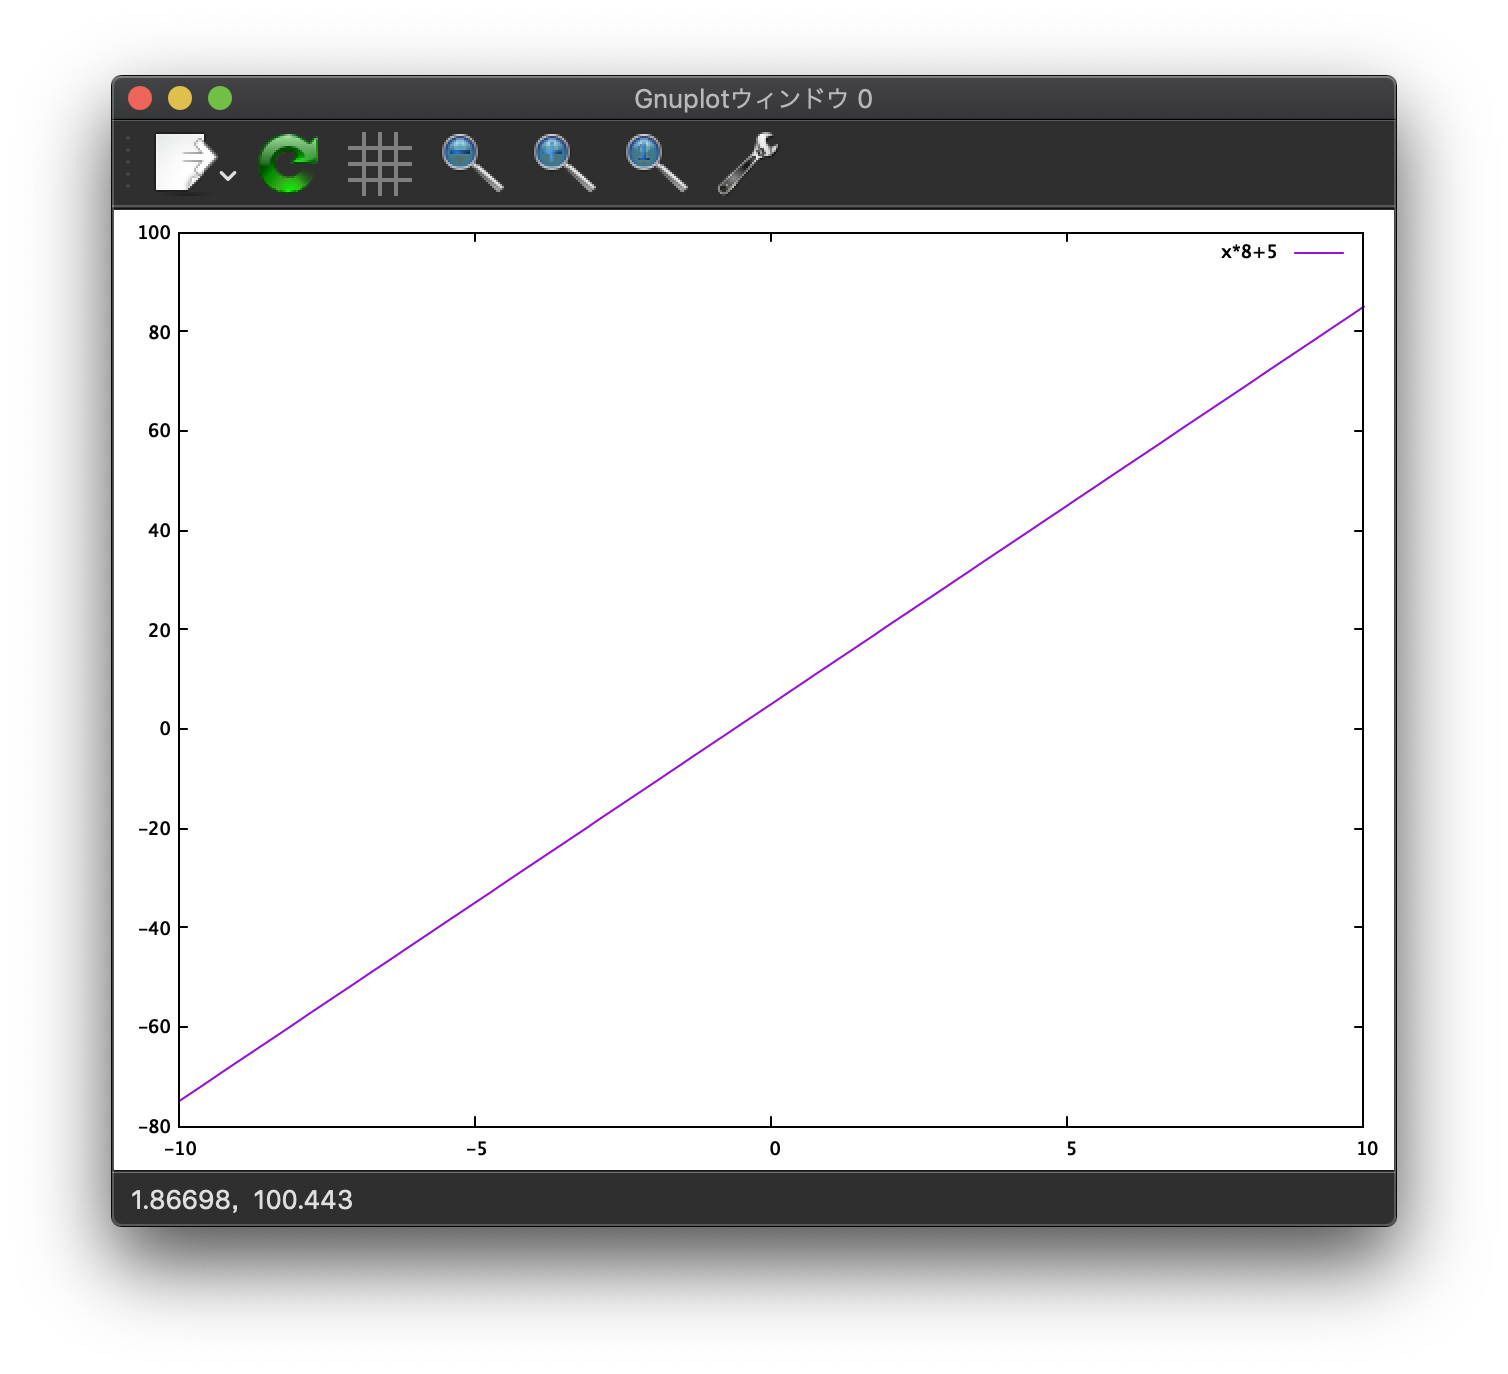
まずy=8x+5を表示してみる。
gnuplot> plot x*8+5
このように入力すると下のようにグラフが作られる。

x軸、y軸の範囲を指定する
x軸の範囲を指定したい時はset xrange [x1:x2]
y軸の範囲を指定したい時はset yrange [y1:y2]をそれぞれ使う
replotはグラフの設定を変える時に使用する。
gnuplot> set xrange [-5:5]
gnuplot> set yrange [-10:20]
gnuplot> replot
そして、できたグラフがこちらです。

x軸、y軸に名前をつけ、グラフ自体にタイトルを付けて、格子線を設定する
x軸の範囲を指定したい時はset xlabel '名前'、
y軸の範囲を指定したい時はset ylabel '名前'、
グラフ自体にタイトルを付ける場合はset title "タイトル"
格子線を設定するにはset gridを使う。
gnuplot> set xlabel 'x軸でーす'
gnuplot> set ylabel 'y軸ンゴ'
gnuplot> set title "これがタイトルです"
gnuplot> set grid
gnuplot> replot
出来上がったグラフはこちらです。

最後に格子線を設定し、pngで画像を保存する
pngで保存したい時はset terminal png
保存先を指定するset output "名前.png"
gnuplotを終了させるにはexitを使う。
gnuplot> set terminal png
gnuplot> set output "gnuplot.png"
gnuplot> replot
gnuplot> exit
sugiyoshi%
これで終わりです。
日本語に対応してないと、日本語がうまく画像に表示されないので注意してください!!!
gnuplotでファイルからデータを読み込んでグラフ2つを表示する
次はファイルからデータを読み込んでグラフを表示するという少し実践的なことをします。
ファイルを作成する
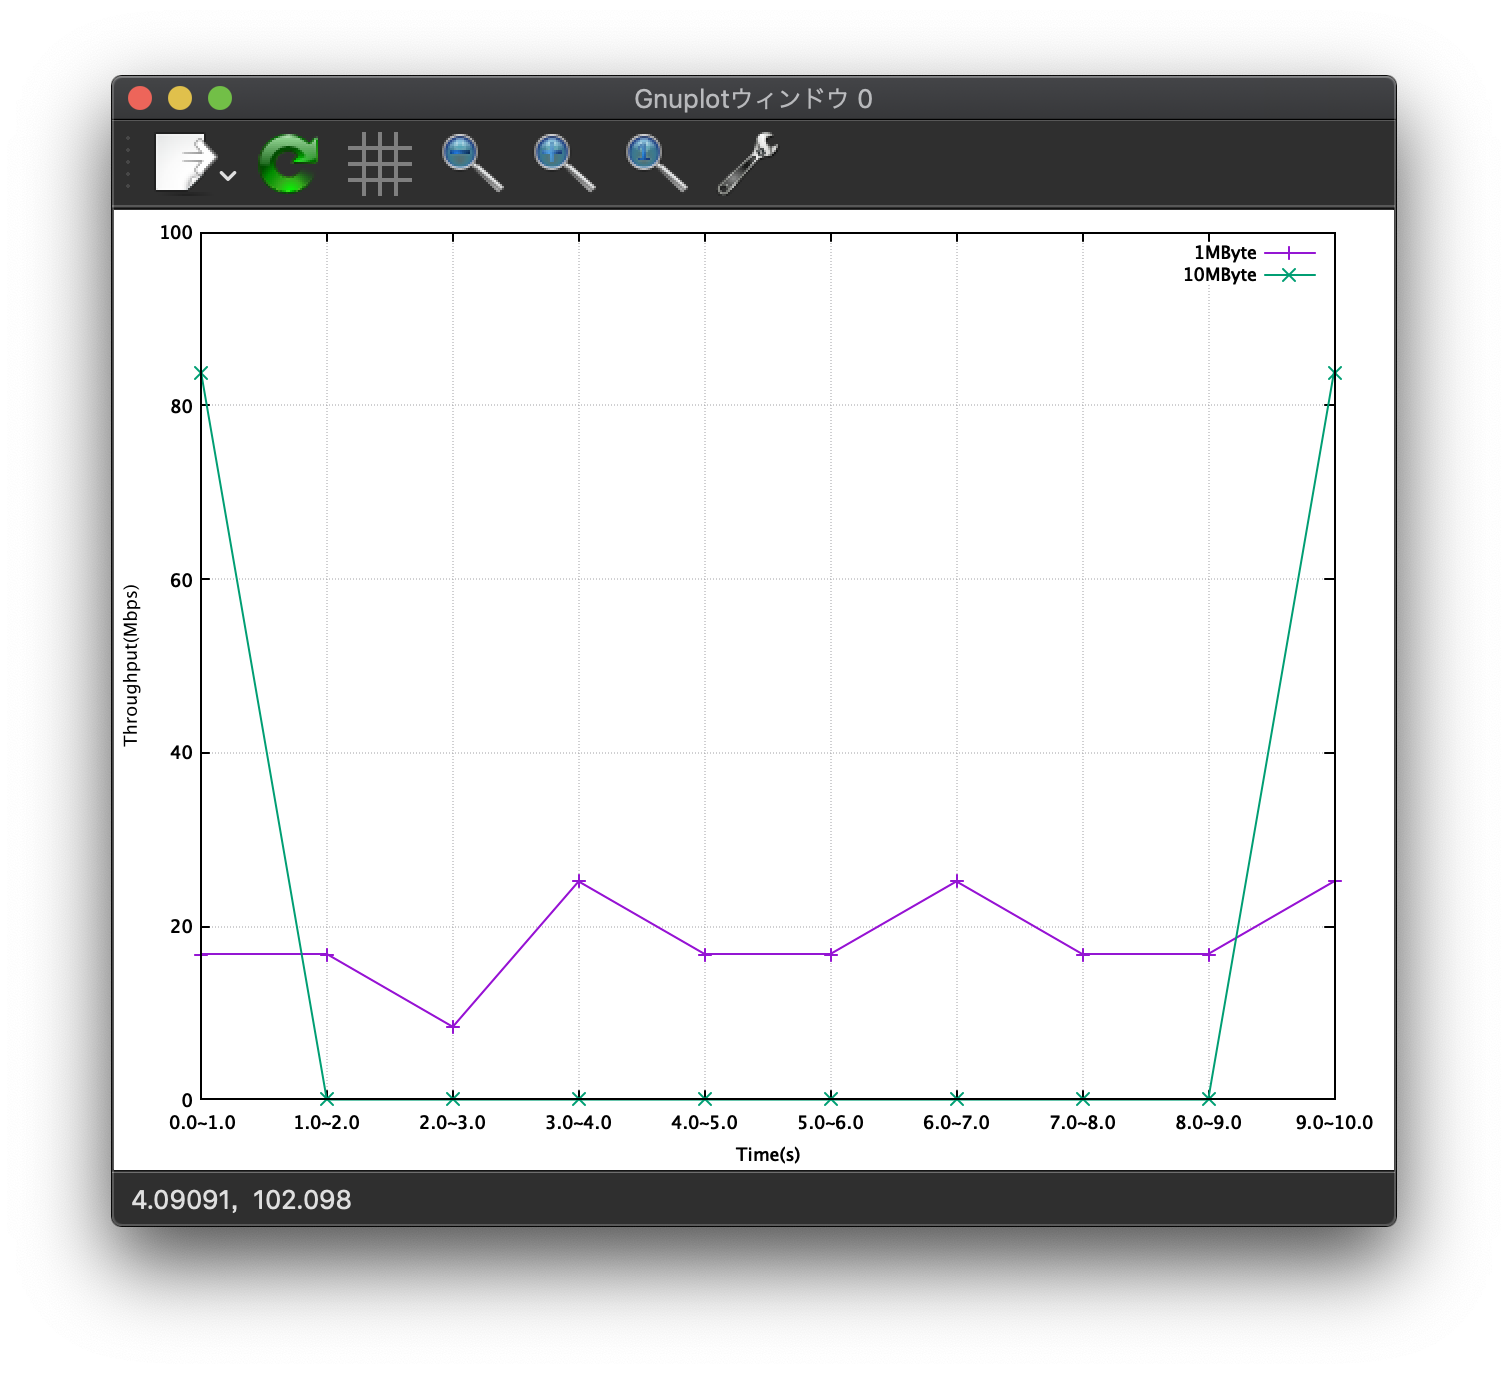
まず、このようにBandWidth.txtというファイルを作成します。
その時に注意してもらいたいのですが、数値と数値の間は必ず空白を1つ以上開けてください。
# Time  1MByte 10MByte
0.0~1.0  16.777 83.886
1.0~2.0  16.777   0.000
2.0~3.0   8.389   0.000
3.0~4.0  25.166   0.000
4.0~5.0  16.777   0.000
5.0~6.0  16.777   0.000
6.0~7.0  25.166   0.000
7.0~8.0  16.777   0.000
8.0~9.0  16.777   0.000
9.0~10.0 25.166  83.886
ファイルから値を取ってきてグラフに挿入する
plot "ファイル名" using 1:2 w lp title "1つ目のグラフの名前"
replot "ファイル名" using 1:3 w lp title "2つ目のグラフの名前"
この時のusing 1:2はファイルの1行目をx軸の値とし、ファイルの2行目をy軸の値とするという意味である。
gnuplot> plot "BandWidth.txt" using 1:2 w lp title "1MByte"
gnuplot> replot "BandWidth.txt" using 1:3 w lp title "10MByte"

簡単な設定を入れる
上の方で説明したので、省略する。
gnuplot> set xlabel 'Time(s)'
gnuplot> set ylabel 'Throughput(Mbps)'
gnuplot> set xrange [0:9]
gnuplot> set yrange [0:100]
gnuplot> set grid

x軸の値を変更する
x軸の値に文字列を入れる時は
set xtics ('文字列' x軸の値, '文字列' x軸の値',………,文字列' x軸の値)を使う。
gnuplot> set xtics ('0.0∼1.0' 0, '1.0∼2.0' 1, '2.0∼3.0' 2, '3.0∼4.0' 3,'4.0∼5.0' 4,'5.0∼6.0' 5,'6.0∼7.0' 6,'7.0∼8.0' 7,'8.0∼9.0' 8,'9.0∼10.0' 9)

保存する
これも上の方で説明したので省く。
gnuplot> set terminal png
gnuplot> set output "BandWidth.png"
gnuplot> replot
終了ですね。
お疲れ様でした。