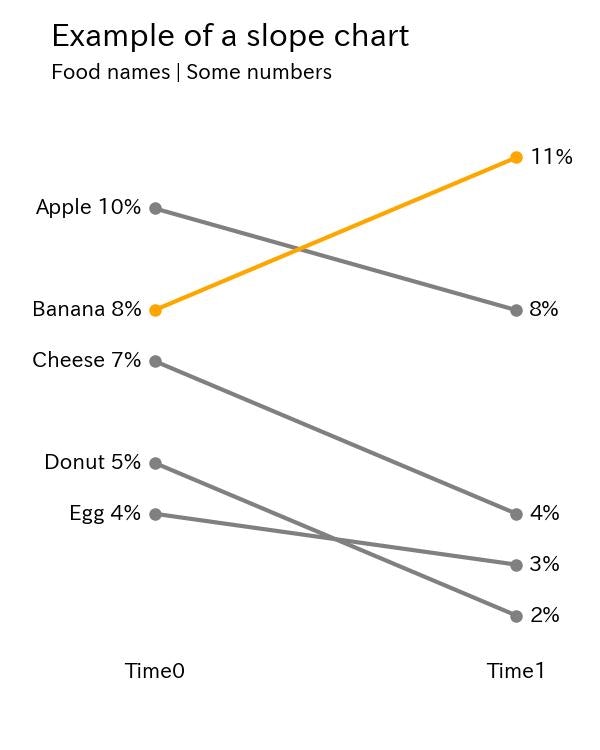
Pythonでいい感じのスロープグラフを描けるコードを書いたので記事にします。
スロープグラフは2時点の前後比較をする際に便利なグラフです。
アウトプットのイメージ
※中身のデータは適当です。
このアウトプットのよいところ
- 余計な情報が削ぎ落とされて見やすい
- 強調したい部分がひと目で分かる
- 直線の傾きで傾向がわかるので理解しやすい
本記事の想定読者
- Pythonユーザー
- matplotlibを利用することがある
- 時系列の前後比較でよいグラフをつくりたい
記事の背景
- 『Google流資料作成術』という筆者イチオシの本があります。 1
データの可視化表現について、極めてシンプルかつ実践的に解説されています。 - この本の中で紹介されているスロープグラフをmatplotlibで描こうとしましたが、
どうしてもコードがごちゃついてしまいました - というわけで、簡単にスロープグラフを描くためのコードを書きました。
- 元ネタは自作ライブラリなので、興味があればそちらも御覧ください。2
最終的なコードの実行部分
データの準備
項目名、最初の時点(time0)の値、次の時点(time1)の値のリストを準備します。
names = ['Apple', 'Banana', 'Cheese', 'Donut', 'Egg']
time0 = [10, 8, 7, 5, 4]
time1 = [8, 11, 4, 2, 3]
シンプル版
グラフ描画の実行コードは以下の通り。
コンテキストマネージャーを使って2行で描けます。
with slope() as slp:
    slp.plot(time0, time1, names)
素の描写だとmatplotlibのデフォルトの配色が適用されます。
ちょっと手の込んでる版
タイトルをつけたり、特定の線にハイライトを充てたりして、
もう少し手の込んだグラフをつくってみます。
title = 'Example of a slope chart'
subtitle = 'Food names | Some numbers'

with slope(figsize=(4, 5)) as slp:
    slp.highlight({'Banana':'orange'})
    slp.config(suffix='%')
    slp.plot(time0, time1, names, xticks=('Time0', 'Time1'),
               title=title, subtitle=subtitle)
ハイライトを指定したときは、自動的に他の線の色をグレーにしています。
値を%表示にしたかったので、config()を使ってsuffix(接尾辞)を設定しています。
コード全文
以下にコード全文を記載します。
from typing import Optional
import matplotlib.pyplot as plt

class Slope:
    """Class for a slope chart"""
    def __init__(self,
        figsize: tuple[float, float] = (6,4),
        dpi: int = 150,
        layout: str = 'tight',
        show: bool =True,
        **kwagrs):

        self.fig = plt.figure(figsize=figsize, dpi=dpi, layout=layout, **kwagrs)
        self.show = show

        self._xstart: float = 0.2
        self._xend: float = 0.8
        self._suffix: str = ''
        self._highlight: dict = {}

    def __enter__(self):
        return(self)

    def __exit__(self, exc_type, exc_value, exc_traceback):
        plt.show() if self.show else None

    def highlight(self, add_highlight: dict) -> None:
        """Set highlight dict

        e.g.
            {'Group A': 'orange', 'Group B': 'blue'}

        """
        self._highlight.update(add_highlight)

    def config(self, xstart: float =0, xend: float =0, suffix: str ='') -> None:
        """Config some parameters

            Args:
                xstart (float): x start point, which can take 0.0〜1.0
                xend (float): x end point, which can take 0.0〜1.0
                suffix (str): Suffix for the numbers of chart e.g. '%'

            Return:
                None

        """
        self._xstart = xstart if xstart else self._xstart
        self._xend = xend if xend else self._xend
        self._suffix = suffix if suffix else self._suffix

    def plot(self, time0: list[float], time1: list[float],
             names: list[float], xticks: Optional[tuple[str,str]] = None,
             title: str ='', subtitle: str =''):
        """Plot a slope chart

        Args:
            time0 (list[float]): Values of start period
            time1 (list[float]): Values of end period
            names (list[str]): Names of each items
            xticks (tuple[str, str]): xticks, default to 'Before' and 'After'
            title (str): Title of the chart
            subtitle (str): Subtitle of the chart, it might be x labels

        Return:
            None

        """

        xticks = xticks if xticks else ('Before', 'After')

        xmin, xmax = 0, 4
        xstart = xmax * self._xstart
        xend = xmax * self._xend
        ymax = max(*time0, *time1)
        ymin = min(*time0, *time1)
        ytop = ymax * 1.2
        ybottom = ymin - (ymax * 0.2)
        yticks_position = ymin - (ymax * 0.1)

        text_args = {'verticalalignment':'center', 'fontdict':{'size':10}}

        for t0, t1, name in zip(time0, time1, names):
            color = self._highlight.get(name, 'gray') if self._highlight else None

            left_text = f'{name} {str(round(t0))}{self._suffix}'
            right_text = f'{str(round(t1))}{self._suffix}'

            plt.plot([xstart, xend], [t0, t1], lw=2, color=color, marker='o', markersize=5)
            plt.text(xstart-0.1, t0, left_text, horizontalalignment='right', **text_args)
            plt.text(xend+0.1, t1, right_text, horizontalalignment='left', **text_args)

        plt.xlim(xmin, xmax)
        plt.ylim(ybottom, ytop)

        plt.text(0, ytop, title, horizontalalignment='left', fontdict={'size':15})
        plt.text(0, ytop*0.95, subtitle, horizontalalignment='left', fontdict={'size':10})

        plt.text(xstart, yticks_position, xticks[0], horizontalalignment='center', **text_args)
        plt.text(xend, yticks_position, xticks[1], horizontalalignment='center', **text_args)
        plt.axis('off')


def slope(
    figsize=(6,4),
    dpi: int = 150,
    layout: str = 'tight',
    show: bool =True,
    **kwargs
    ):
    """Context manager for a slope chart"""

    slp = Slope(figsize=figsize, dpi=dpi, layout=layout, show=show, **kwargs)

    return slp

# Make a simple slope chart
names = ['Apple', 'Banana', 'Cheese', 'Donut', 'Egg']
time0 = [10, 8, 7, 5, 4]
time1 = [8, 11, 4, 2, 3]

with slope() as slp:
    slp.plot(time0, time1, names)

# Make another chart which a little more complicated
title = 'Example of a slope chart'
subtitle = 'Food names | Some numbers'

with slope(figsize=(4, 5)) as slp:
    slp.highlight({'Banana':'orange'})
    slp.config(suffix='%')
    slp.plot(time0, time1, names, xticks=('Time0', 'Time1'),
               title=title, subtitle=subtitle)
docstringも入っていて、少し縦に長いです。
体裁に気をつけてスロープグラフを描こうとするとやはりコードが長くなりますね。
毎回長いコードを書くのではなく、処理をまとめたコードを1回準備して、
あとはそれを使いまわして簡潔なコードでスロープグラフ描画をしよう、という趣旨です。
コードのざっくり解説
コンテキストマネージャー
with句で始まる書き方をするのは、コンテキストマネージャーを使ってコードを簡略化するためです。
コンテキストマネージャーについて筆者理解で簡単にいうと、
あるclassにwith句を適用すると(class側に__enter__と__exit__が必要)、
with句に入る時と出る時に__enter__と__exit__で定義された処理をそれぞれ実行してくれます。
今回はこの__enter__でfigureをつくって、__exit__でplt.show()をしています。
plot()の中身
今回のコードの中核です。
そのほとんどは図表の適切な位置に適切なグラフと文言を載せるためのものです。
xもしくはyが接頭辞になっているコードは、各要素をxy平面上によしなに配置するためのものです。
xy平面上のよきところにplt.text()で項目名やタイトルなどを配置しています。
今回は極力不要な要素を削るために、図の縦横軸もoffにしています。
そのため、タイトルについてもきちんと位置を指定する必要があります。
なお、xyの座標はわりとざっくりと目で見てよさそうな位置を指定しているので、
値のスケールや他の要因で見た目が崩れる可能性があります。あしからず。
結論(グラフとコードの再掲)
with slope() as slp:
    slp.plot(time0, time1, names)
title = 'Example of a slope chart'
subtitle = 'Food names | Some numbers'

with slope(figsize=(4, 5)) as slp:
    slp.highlight({'Banana':'orange'})
    slp.config(suffix='%')
    slp.plot(time0, time1, names, xticks=('Time0', 'Time1'),
               title=title, subtitle=subtitle)
まとめ
- スロープグラフを使うと前後比較がわかりやすく表現できる!
- でも、体裁に気をつけてスロープグラフを描くのは結構ややこしい…
- だから処理をまとめて書いておいて、あとは使い回すと楽!
おまけ
元ネタのnecoplotだとこんなふうに書けます(グラフは省略)。2
import necoplot as neco

# Make a simple slope chart
names = ['Apple', 'Banana', 'Cheese', 'Donut', 'Egg']
time0 = [10, 8, 7, 5, 4]
time1 = [8, 11, 4, 2, 3]

with neco.slope() as slope:
    slope.plot(time0, time1, names)
# Make another chart which a little more complicated
title = 'Example of a slope chart'
subtitle = 'Food names | Some numbers'

with neco.slope(figsize=(4, 5)) as slope:
    slope.highlight({'Banana':'orange'})
    slope.config(xstart=0.2, xend=0.9, suffix='%')
    slope.plot(time0, time1, names, xticks=('Time0', 'Time1'),
               title=title, subtitle=subtitle)
-
筆者は一時期データ可視化の方法について悩み、いろいろ本を読んでみたのですが、
個人的にはこの本がダントツでわかりやすく、ためになりました。
『Google流資料作成術』
https://www.amazon.co.jp/dp/4534054726 ↩

