はじめに
PythonのライブラリStatsModelsを使用して重回帰分析をやってみます。Rと違って少々不便です。
環境
- Google Colaboratory
- statsmodels==0.9.0
参考
手順
データの読み込み
ボストン市の住宅価格データを使用します。ボストン市の住宅価格を目的変数、NOxの濃度や部屋数などを説明変数として持っているデータです。
scipyが1.3だとstatsmodelsの0.9.0が使用できないのでダウングレード後、ランタイムを再起動します。
!pip install scipy==1.2
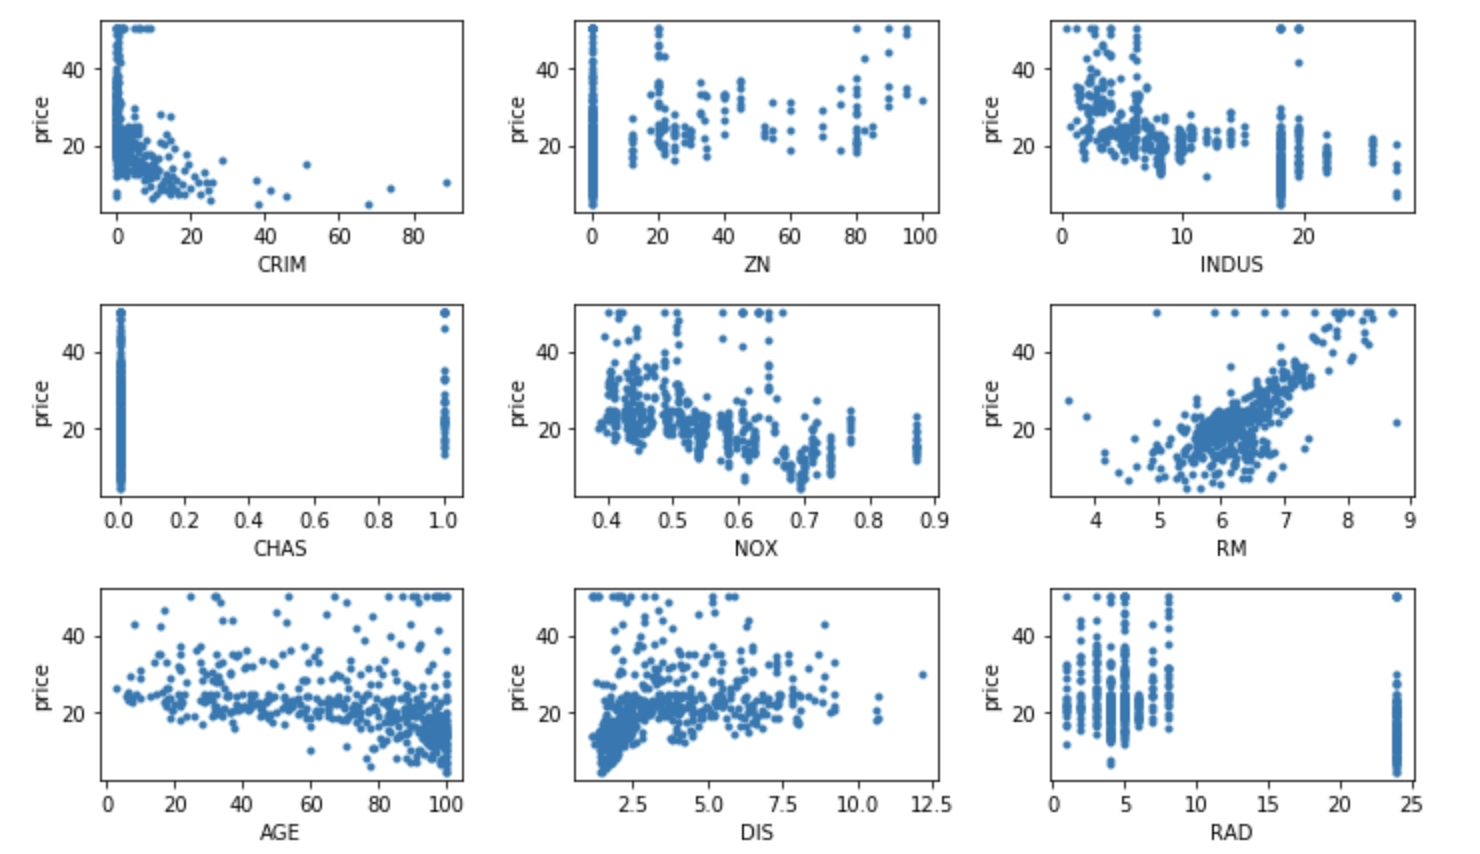
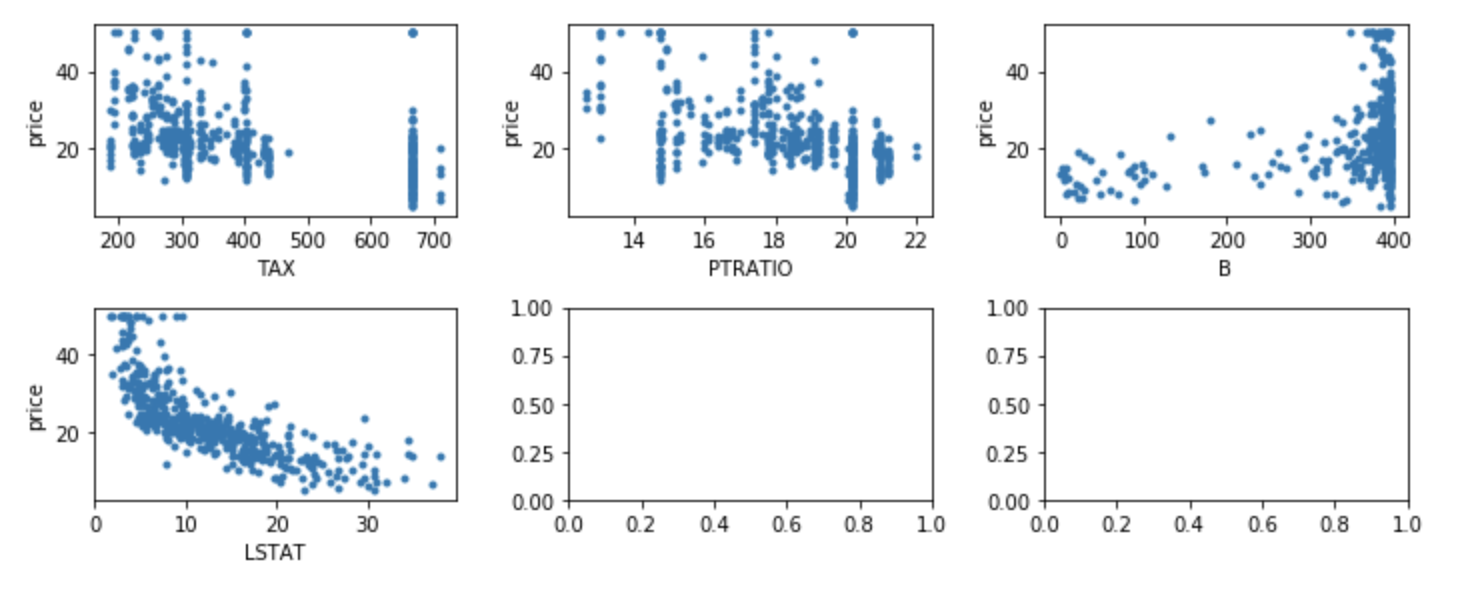
データを読み込み、プロットして確認してみます。
# 必須のモジュール
import pandas as pd
import numpy as np
import matplotlib.pyplot as plt
import seaborn as sns
from sklearn.datasets import load_boston


# データを読み込み
boston = load_boston()

# 目的変数と説明変数の関係を確認
fig, ax = plt.subplots(5, 3, figsize=(15, 15))
xlabels = boston.feature_names
for i in range(5):
    for j in range(3):
        if 3*i+j >= 13:
            break

        ax[i, j].scatter(boston.data[:, 3*i+j], boston.target, marker='.')
        ax[i, j].set_xlabel(xlabels[3*i+j])
        ax[i, j].set_ylabel("price")

plt.tight_layout()
plt.show()
相関係数を算出
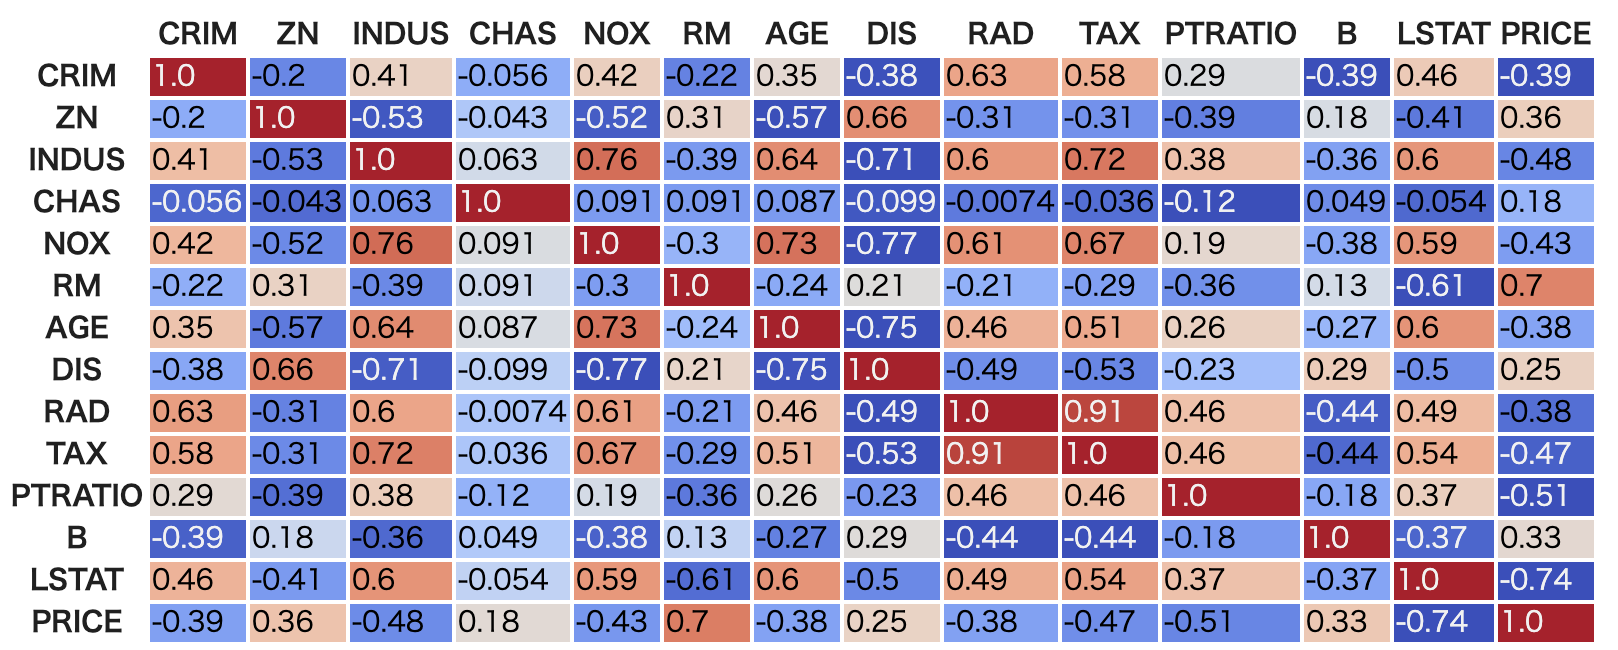
重回帰分析をする上では変数間の相関が、多重共線性として問題になります。そこで変数間の相関を確認しておきます。
# 目的変数と説明変数を一つのデータフレームにまとめる
df = pd.DataFrame(boston.data, columns=boston.feature_names)
df['PRICE'] = boston.target

# 相関を計算
corr = df.corr()

# データフレームに色をつける
corr.style.format("{:.2}").background_gradient(cmap=plt.get_cmap('coolwarm'), axis=1)
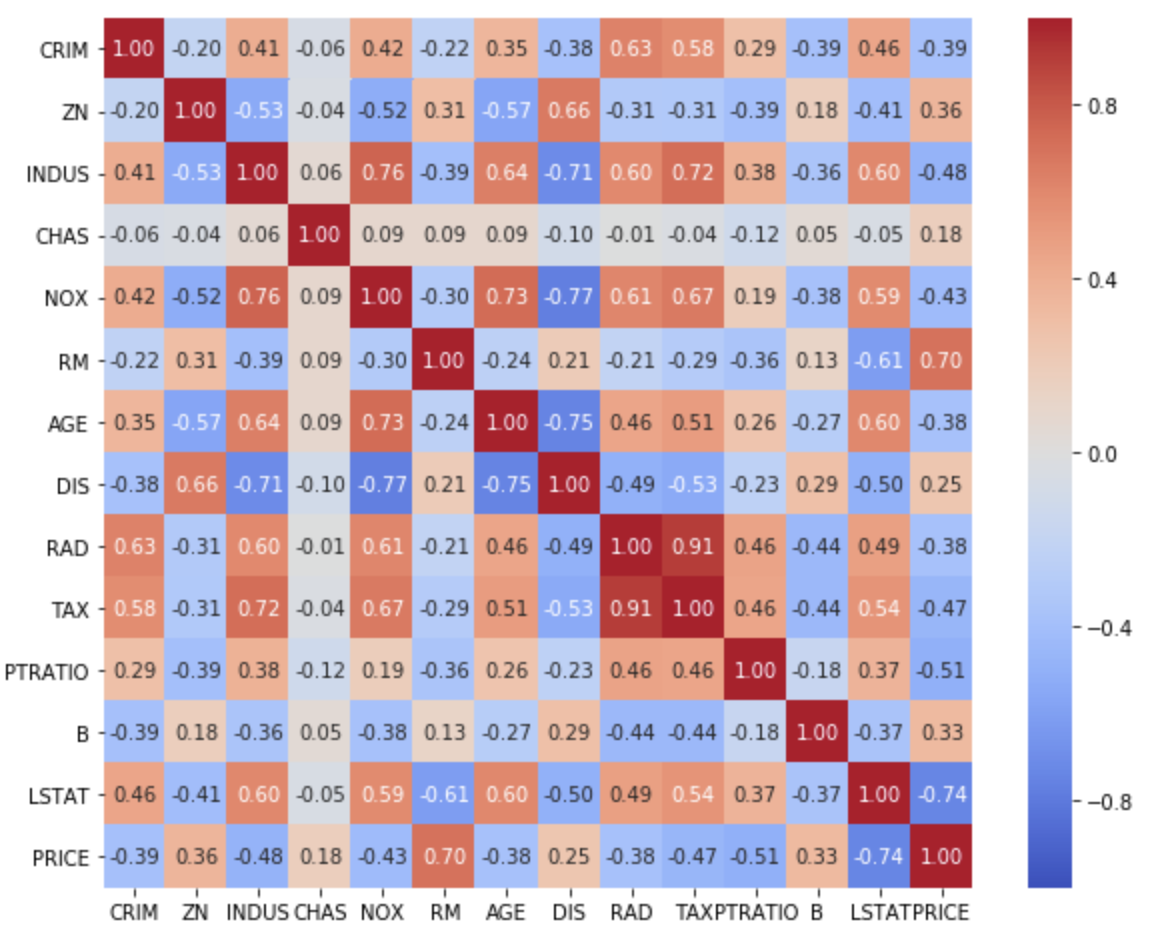
seabornでも同様のヒートマップを作成できます。
fig, ax = plt.subplots(figsize=(10, 8))
sns.heatmap(corr, vmax=1, vmin=-1, center=0, annot=True, cbar=True, cmap='coolwarm', square=True, fmt='.2f', ax=ax)
変数減少法で重回帰分析
変数減少法を使用して分析してみます。
まずデータを準備します。
from sklearn.model_selection import train_test_split


X = df.drop('PRICE', axis=1)
y = df['PRICE']

# テータ分割
X_train, X_test, y_train, y_test = train_test_split(X, y, train_size =0.8, random_state=0)
全変数を使用して重回帰分析をしてみます。
import statsmodels.api as sm

# 回帰モデル作成
mod = sm.OLS(y_train, sm.add_constant(X_train))

# 訓練
result = mod.fit()

# 統計サマリを表示
print(result.summary())


                            OLS Regression Results
==============================================================================
Dep. Variable:                  PRICE   R-squared:                       0.773
Model:                            OLS   Adj. R-squared:                  0.765
Method:                 Least Squares   F-statistic:                     102.2
Date:                Thu, 23 May 2019   Prob (F-statistic):          9.64e-117
Time:                        17:39:57   Log-Likelihood:                -1171.5
No. Observations:                 404   AIC:                             2371.
Df Residuals:                     390   BIC:                             2427.
Df Model:                          13
Covariance Type:            nonrobust
==============================================================================
                 coef    std err          t      P>|t|      [0.025      0.975]
------------------------------------------------------------------------------
const         38.0917      5.522      6.898      0.000      27.234      48.949
CRIM          -0.1194      0.037     -3.257      0.001      -0.192      -0.047
ZN             0.0448      0.014      3.102      0.002       0.016       0.073
INDUS          0.0055      0.063      0.087      0.931      -0.119       0.130
CHAS           2.3408      0.902      2.595      0.010       0.567       4.115
NOX          -16.1236      4.212     -3.828      0.000     -24.404      -7.843
RM             3.7087      0.458      8.106      0.000       2.809       4.608
AGE           -0.0031      0.014     -0.218      0.828      -0.031       0.025
DIS           -1.3864      0.214     -6.480      0.000      -1.807      -0.966
RAD            0.2442      0.070      3.481      0.001       0.106       0.382
TAX           -0.0110      0.004     -2.819      0.005      -0.019      -0.003
PTRATIO       -1.0459      0.137     -7.636      0.000      -1.315      -0.777
B              0.0081      0.003      2.749      0.006       0.002       0.014
LSTAT         -0.4928      0.054     -9.086      0.000      -0.599      -0.386
==============================================================================
Omnibus:                      141.494   Durbin-Watson:                   1.996
Prob(Omnibus):                  0.000   Jarque-Bera (JB):              629.882
Skew:                           1.470   Prob(JB):                    1.67e-137
Kurtosis:                       8.365   Cond. No.                     1.55e+04
==============================================================================

Warnings:
[1] Standard Errors assume that the covariance matrix of the errors is correctly specified.
[2] The condition number is large, 1.55e+04. This might indicate that there are
strong multicollinearity or other numerical problems.
多重共線性の疑いのある変数を探します。
最初にそれぞれの説明変数と目的変数の相関係数を計算しました。もし変数が独立であれば、回帰係数も相関係数と同じ符号になるはずです。しかし多重共線性があると、回帰係数が一意に決まらず不安定になり、相関係数と異なる符号になる場合があります。これを確認してみます。
# constを除くために1から始める
np.sign(result.params[1:])

# 目的変数を除くために-1までとする
np.sign(corr['PRICE'][:-1])

# 0でない変数が相関している可能性あり
np.sign(result.params[1:]) - np.sign(corr['PRICE'][:-1])

CRIM       0.0
ZN         0.0
INDUS      2.0
CHAS       0.0
NOX        0.0
RM         0.0
AGE        0.0
DIS       -2.0
RAD        2.0
TAX        0.0
PTRATIO    0.0
B          0.0
LSTAT      0.0
dtype: float64
INDUS、DIS、RADを取り除いて回帰分析してみます。
# 回帰モデル作成
d = ['INDUS', 'DIS', 'RAD']
mod = sm.OLS(y_train, sm.add_constant(X_train.drop(d, axis=1)))

# 訓練
result = mod.fit()

# 統計サマリを表示
print(result.summary())


                            OLS Regression Results
==============================================================================
Dep. Variable:                  PRICE   R-squared:                       0.742
Model:                            OLS   Adj. R-squared:                  0.735
Method:                 Least Squares   F-statistic:                     112.9
Date:                Thu, 23 May 2019   Prob (F-statistic):          5.42e-109
Time:                        17:42:50   Log-Likelihood:                -1197.5
No. Observations:                 404   AIC:                             2417.
Df Residuals:                     393   BIC:                             2461.
Df Model:                          10
Covariance Type:            nonrobust
==============================================================================
                 coef    std err          t      P>|t|      [0.025      0.975]
------------------------------------------------------------------------------
const         19.6164      5.196      3.776      0.000       9.402      29.831
CRIM          -0.0603      0.037     -1.632      0.104      -0.133       0.012
ZN             0.0022      0.014      0.158      0.874      -0.025       0.029
CHAS           2.9510      0.949      3.111      0.002       1.086       4.816
NOX           -5.3578      4.024     -1.331      0.184     -13.269       2.554
RM             4.4060      0.471      9.359      0.000       3.480       5.332
AGE            0.0202      0.015      1.393      0.164      -0.008       0.049
TAX           -0.0003      0.002     -0.122      0.903      -0.005       0.004
PTRATIO       -1.0610      0.141     -7.516      0.000      -1.339      -0.783
B              0.0076      0.003      2.457      0.014       0.002       0.014
LSTAT         -0.4918      0.057     -8.562      0.000      -0.605      -0.379
==============================================================================
Omnibus:                      166.959   Durbin-Watson:                   1.995
Prob(Omnibus):                  0.000   Jarque-Bera (JB):              885.215
Skew:                           1.706   Prob(JB):                    6.00e-193
Kurtosis:                       9.399   Cond. No.                     1.35e+04
==============================================================================

Warnings:
[1] Standard Errors assume that the covariance matrix of the errors is correctly specified.
[2] The condition number is large, 1.35e+04. This might indicate that there are
strong multicollinearity or other numerical problems.
もう一度確認。
(np.sign(result.params[1:]) - np.sign(corr['PRICE'][:-1])).dropna()

AGE        2.0
B          0.0
CHAS       0.0
CRIM       0.0
LSTAT      0.0
NOX        0.0
PTRATIO    0.0
RM         0.0
TAX        0.0
ZN         0.0
dtype: float64
今度はAGEを落としてみる。
                            OLS Regression Results
==============================================================================
Dep. Variable:                  PRICE   R-squared:                       0.741
Model:                            OLS   Adj. R-squared:                  0.735
Method:                 Least Squares   F-statistic:                     125.0
Date:                Thu, 23 May 2019   Prob (F-statistic):          1.23e-109
Time:                        17:47:01   Log-Likelihood:                -1198.5
No. Observations:                 404   AIC:                             2417.
Df Residuals:                     394   BIC:                             2457.
Df Model:                           9
Covariance Type:            nonrobust
==============================================================================
                 coef    std err          t      P>|t|      [0.025      0.975]
------------------------------------------------------------------------------
const         18.1151      5.089      3.560      0.000       8.111      28.120
CRIM          -0.0622      0.037     -1.682      0.093      -0.135       0.011
ZN            -0.0037      0.013     -0.284      0.777      -0.030       0.022
CHAS           2.9959      0.949      3.156      0.002       1.130       4.862
NOX           -2.8646      3.609     -0.794      0.428      -9.959       4.230
RM             4.5634      0.458      9.973      0.000       3.664       5.463
TAX           -0.0004      0.002     -0.165      0.869      -0.005       0.004
PTRATIO       -1.0582      0.141     -7.488      0.000      -1.336      -0.780
B              0.0082      0.003      2.656      0.008       0.002       0.014
LSTAT         -0.4617      0.053     -8.664      0.000      -0.566      -0.357
==============================================================================
Omnibus:                      176.632   Durbin-Watson:                   1.980
Prob(Omnibus):                  0.000   Jarque-Bera (JB):             1038.791
Skew:                           1.782   Prob(JB):                    2.69e-226
Kurtosis:                      10.001   Cond. No.                     1.27e+04
==============================================================================

Warnings:
[1] Standard Errors assume that the covariance matrix of the errors is correctly specified.
[2] The condition number is large, 1.27e+04. This might indicate that there are
strong multicollinearity or other numerical problems.
(np.sign(result.params[1:]) - np.sign(corr['PRICE'][:-1])).dropna()

B          0.0
CHAS       0.0
CRIM       0.0
LSTAT      0.0
NOX        0.0
PTRATIO    0.0
RM         0.0
TAX        0.0
ZN        -2.0
dtype: float64
今度はZNを落としてみる。
                            OLS Regression Results
==============================================================================
Dep. Variable:                  PRICE   R-squared:                       0.741
Model:                            OLS   Adj. R-squared:                  0.735
Method:                 Least Squares   F-statistic:                     140.9
Date:                Thu, 23 May 2019   Prob (F-statistic):          1.04e-110
Time:                        17:48:32   Log-Likelihood:                -1198.5
No. Observations:                 404   AIC:                             2415.
Df Residuals:                     395   BIC:                             2451.
Df Model:                           8
Covariance Type:            nonrobust
==============================================================================
                 coef    std err          t      P>|t|      [0.025      0.975]
------------------------------------------------------------------------------
const         17.6474      4.809      3.670      0.000       8.193      27.102
CRIM          -0.0625      0.037     -1.695      0.091      -0.135       0.010
CHAS           3.0095      0.947      3.178      0.002       1.148       4.871
NOX           -2.3888      3.192     -0.748      0.455      -8.664       3.887
RM             4.5523      0.455      9.997      0.000       3.657       5.448
TAX           -0.0005      0.002     -0.232      0.817      -0.005       0.004
PTRATIO       -1.0433      0.131     -7.961      0.000      -1.301      -0.786
B              0.0082      0.003      2.666      0.008       0.002       0.014
LSTAT         -0.4611      0.053     -8.670      0.000      -0.566      -0.357
==============================================================================
Omnibus:                      176.890   Durbin-Watson:                   1.980
Prob(Omnibus):                  0.000   Jarque-Bera (JB):             1043.397
Skew:                           1.784   Prob(JB):                    2.69e-227
Kurtosis:                      10.018   Cond. No.                     1.17e+04
==============================================================================

Warnings:
[1] Standard Errors assume that the covariance matrix of the errors is correctly specified.
[2] The condition number is large, 1.17e+04. This might indicate that there are
strong multicollinearity or other numerical problems.
(np.sign(result.params[1:]) - np.sign(corr['PRICE'][:-1])).dropna()

B          0.0
CHAS       0.0
CRIM       0.0
LSTAT      0.0
NOX        0.0
PTRATIO    0.0
RM         0.0
TAX        0.0
dtype: float64
$t^2<2$の変数があるので更に変数を落とす。絶対値が一番小さいTAXを落とす。
                            OLS Regression Results
==============================================================================
Dep. Variable:                  PRICE   R-squared:                       0.740
Model:                            OLS   Adj. R-squared:                  0.736
Method:                 Least Squares   F-statistic:                     161.4
Date:                Thu, 23 May 2019   Prob (F-statistic):          8.14e-112
Time:                        17:50:47   Log-Likelihood:                -1198.5
No. Observations:                 404   AIC:                             2413.
Df Residuals:                     396   BIC:                             2445.
Df Model:                           7
Covariance Type:            nonrobust
==============================================================================
                 coef    std err          t      P>|t|      [0.025      0.975]
------------------------------------------------------------------------------
const         17.8533      4.721      3.782      0.000       8.572      27.134
CRIM          -0.0654      0.035     -1.888      0.060      -0.134       0.003
CHAS           3.0146      0.945      3.188      0.002       1.156       4.873
NOX           -2.7882      2.684     -1.039      0.300      -8.065       2.489
RM             4.5483      0.454     10.007      0.000       3.655       5.442
PTRATIO       -1.0551      0.121     -8.736      0.000      -1.292      -0.818
B              0.0084      0.003      2.756      0.006       0.002       0.014
LSTAT         -0.4611      0.053     -8.680      0.000      -0.566      -0.357
==============================================================================
Omnibus:                      175.198   Durbin-Watson:                   1.981
Prob(Omnibus):                  0.000   Jarque-Bera (JB):             1019.678
Skew:                           1.768   Prob(JB):                    3.80e-222
Kurtosis:                       9.933   Cond. No.                     7.56e+03
==============================================================================

Warnings:
[1] Standard Errors assume that the covariance matrix of the errors is correctly specified.
[2] The condition number is large, 7.56e+03. This might indicate that there are
(np.sign(result.params[1:]) - np.sign(corr['PRICE'][:-1])).dropna()

B          0.0
CHAS       0.0
CRIM       0.0
LSTAT      0.0
NOX        0.0
PTRATIO    0.0
RM         0.0
dtype: float64
今度はNOXを落とす。
# 回帰モデル作成
d = ['INDUS', 'DIS', 'RAD', 'AGE', 'ZN', 'TAX', 'NOX']
mod = sm.OLS(y_train, sm.add_constant(X_train.drop(d, axis=1)))

# 訓練
result = mod.fit()

# 統計サマリを表示
print(result.summary())


                            OLS Regression Results
==============================================================================
Dep. Variable:                  PRICE   R-squared:                       0.740
Model:                            OLS   Adj. R-squared:                  0.736
Method:                 Least Squares   F-statistic:                     188.1
Date:                Thu, 23 May 2019   Prob (F-statistic):          9.72e-113
Time:                        17:53:56   Log-Likelihood:                -1199.1
No. Observations:                 404   AIC:                             2412.
Df Residuals:                     397   BIC:                             2440.
Df Model:                           6
Covariance Type:            nonrobust
==============================================================================
                 coef    std err          t      P>|t|      [0.025      0.975]
------------------------------------------------------------------------------
const         16.4182      4.515      3.637      0.000       7.543      25.294
CRIM          -0.0726      0.034     -2.138      0.033      -0.139      -0.006
CHAS           2.9178      0.941      3.101      0.002       1.068       4.768
RM             4.5315      0.454      9.976      0.000       3.638       5.425
PTRATIO       -1.0490      0.121     -8.695      0.000      -1.286      -0.812
B              0.0089      0.003      2.970      0.003       0.003       0.015
LSTAT         -0.4830      0.049     -9.903      0.000      -0.579      -0.387
==============================================================================
Omnibus:                      168.794   Durbin-Watson:                   1.973
Prob(Omnibus):                  0.000   Jarque-Bera (JB):              933.196
Skew:                           1.711   Prob(JB):                    2.29e-203
Kurtosis:                       9.613   Cond. No.                     7.10e+03
==============================================================================

Warnings:
[1] Standard Errors assume that the covariance matrix of the errors is correctly specified.
[2] The condition number is large, 7.1e+03. This might indicate that there are
strong multicollinearity or other numerical problems.
(np.sign(result.params[1:]) - np.sign(corr['PRICE'][:-1])).dropna()

B          0.0
CHAS       0.0
CRIM       0.0
LSTAT      0.0
PTRATIO    0.0
RM         0.0
dtype: float64
$t^2<2$の変数はないので、これで終了。決定係数は0.740、自由度調整済み決定係数は0.736となりました。
参考指標としてテストデータの決定係数を計算。
y_pred = result.predict(sm.add_constant(X_test.drop(d, axis=1)))

se = np.sum(np.square(y_test-y_pred))
st = np.sum(np.square(y_test-np.mean(y_test)))
R2 = 1-se/st
print('決定係数:', R2)

決定係数: 0.5009870040610696
おわりに
今回は変数減少法で、各説明変数の有意性に基づいてモデルを作成しました。
他にも変数を増加させる方法や、増減を組み合わせた方法などがあります。Rだとこれらの作業を自動でやってくれるようですがpythonには無いようです。
また、予測性能だけでモデルの良し悪しを測るのであれば、説明変数選択規準を用いてモデルを決めても良いでしょう。この場合は上でやって来たように変数選択をしつつ、選択規準を満たすようなモデルを選ぶことになります。


