日本語でのmatplotlibでのグラフ中への交点表示方法があまり探しても出てこなかったのでサンプルソースとともに載せておきます。
ここでは例として$y1 = x^3$, $y2 = 3x^2$の交点を求め, 表示しています。
import numpy as np
import matplotlib.pyplot as plt

x = np.array([i for i in range(10)])
y1 = x ** 3
y2 = 3 * x ** 2

# 交点の座標を取得
idx = np.argwhere(np.sign(y1 - y2) == 0)
# 交点をグラフにプロット
plt.plot(x[idx], y1[idx], 'ms', ms=5, label='Intersection', color='green')
plt.xlabel("x")
plt.ylabel("y")
# 交点の座標をグラフに追記
for i in idx.ravel():
    plt.text(x[i], y1[i], '({x}, {y})'.format(x=x[i], y=y1[i]), fontsize=10)
plt.plot(x, y1, color='red', label='y1')
plt.plot(x, y2, color='blue', label='y2')
plt.legend()
plt.show()
実行結果
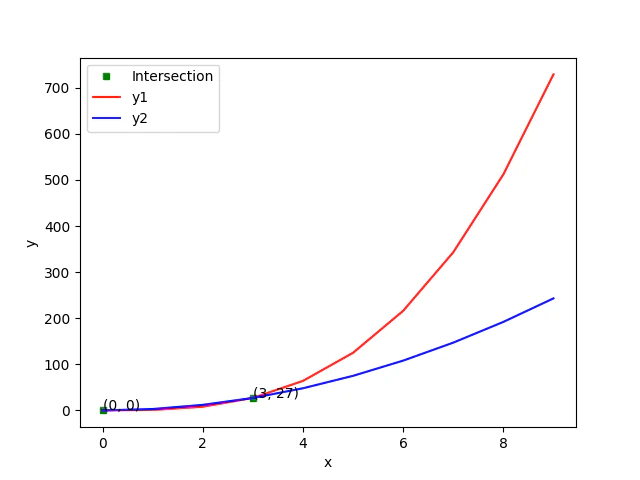
少し見辛いですが, 交点の座標がグラフ中に表示されていることがわかるかと思います。
表示する位置はx, yを変えてあげると見やすくなると思います。
交点の座標取得では, y1とy2のxが同じである点の座標を比較して, 差が0であった時のx座標をidxに格納しています。
xのステップ数を1刻みではなく0.1刻みや0.01刻み等もっと細かくすれば, 小数点や$√$での交点の値でも取れるのではと思います。
何かご指摘やご意見等ございましたら是非お知らせください。