Laravel Debugbarとは名前にもある通り、デバッグを便利にしてくれるパッケージです。
フロントをbladeで開発している場合はbladeのデバッグがしづらいと感じることが多いのですが、Laravel Debugbarを導入していると渡されているパラメータの確認もできるため便利だったりします。
導入も簡単で設定が必要なこともほとんどなく、既存の実装に影響を与えるようなこともなく利用できるのもかなり嬉しいです。
簡単に導入から設定についての説明と自分がよく使っている機能について紹介したいと思います。
導入
インストールするには以下のコマンドを実行します。
composer require --dev barryvdh/laravel-debugbar
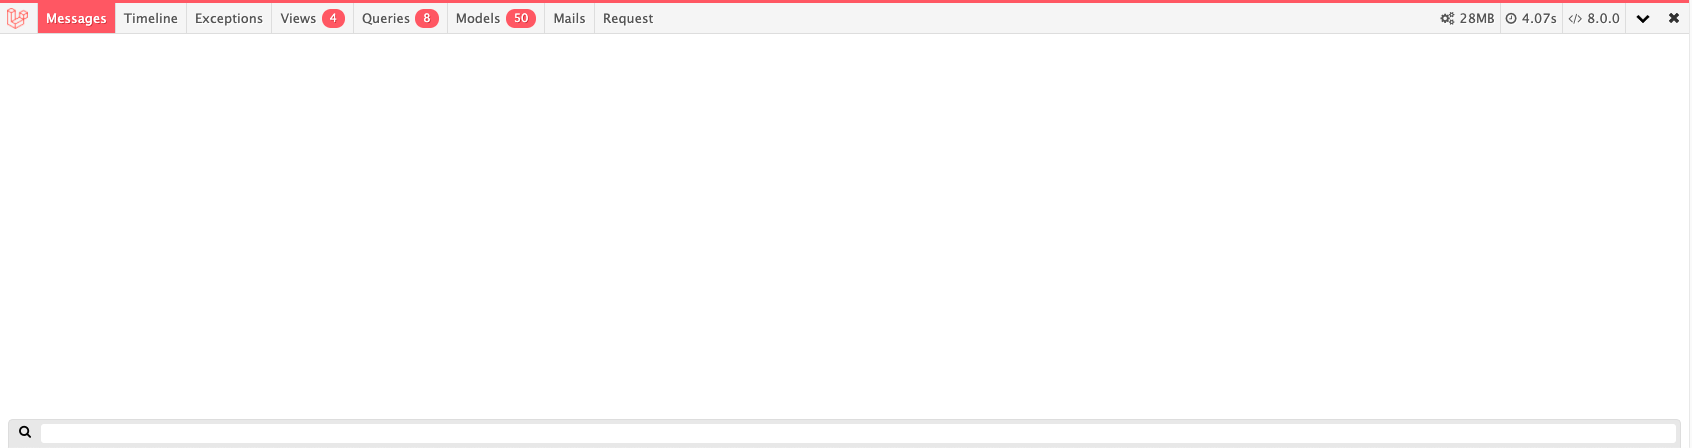
インストール後APP_DEBUGの値がtrueの場合、ページ上に画像のようなものが表示されます。
設定
デフォルトではいくつかのタブが選択できるようになっていますが、追加で設定すると他の情報も表示させることができます。
設定を変更したい場合は、まず以下のコマンドを実行することで設定ファイルconfig/debugbar.phpを生成します。
php artisan vendor:publish --provider="Barryvdh\Debugbar\ServiceProvider"
collectors
true/falseを設定することで取得する情報の取捨選択ができます。
 'collectors' => [
    'phpinfo'         => true,  // Php version
    'messages'        => true,  // Messages
    'time'            => true,  // Time Datalogger
    'memory'          => true,  // Memory usage
    'exceptions'      => true,  // Exception displayer
    'log'             => true,  // Logs from Monolog (merged in messages if enabled)
    'db'              => true,  // Show database (PDO) queries and bindings
    'views'           => true,  // Views with  their data
    'route'           => true,  // Current route information
    'auth'            => false, // Display Laravel authentication status
    'gate'            => true,  // Display Laravel Gate checks
    'session'         => true,  // Display session data
    'symfony_request' => true,  // Only one can be enabled..
    'mail'            => true,  // Catch mail messages
    'laravel'         => true,  // Laravel version and environment
    'events'          => true,  // All events fired
    'default_request' => false, // Regular or special Symfony request logger
    'logs'            => false, // Add the latest log messages
    'files'           => false, // Show the included files
    'config'          => false, // Display config settings
    'cache'           => false, // Display cache events
    'models'          => true,  // Display models
    'livewire'        => true,  // Display Livewire (when available)
],
個人的によく使う項目はmessages db views session です。
options
取得する情報に更に情報を付加することができます。
'options' => [
    'auth'  => [
        'show_name' => false,  // Also show the users name/email in the debugbar
    ],
    'db'    => [
        'with_params'             => false,   // Render SQL with the parameters substituted
        'backtrace'               => false,   // Use a backtrace to find the origin of the query in your files.
        'backtrace_exclude_paths' => [],      // Paths to exclude from backtrace. (in addition to defaults)
        'timeline'                => false,   // Add the queries to the timeline
        'duration_background'     => false,   // Show shaded background on each query relative to how long it took to execute.
        'explain'                 => [        // Show EXPLAIN output on queries
            'enabled' => false,
            'types'   => ['SELECT'],  // Deprecated setting, is always only SELECT
        ],
        'hints'                   => false,  // Show hints for common mistakes
        'show_copy'               => false,  // Show copy button next to the query
    ],
    'mail'  => [
        'full_log' => false,
    ],
    'views' => [
        'timeline' => false,  // Add the views to the timeline (Experimental)
        'data'     => true,   // Note: Can slow down the application, because the data can be quite large..
    ],
    'route' => [
        'label' => true,   // show complete route on bar
    ],
    'logs'  => [
        'file' => null,
    ],
    'cache' => [
        'values' => true,   // collect cache values
    ],
],
理由は後述するのですが、可能ならばviews の data はtrueにしておくことをお勧めします。
よく使う項目
自分がよく使う便利な項目を紹介します。
Messages
出力されたログの内容がこの項目で確認できます。
Debugbar::info('info');
Debugbar::error('Error!');
Debugbar::warning('Watch out…');
Debugbar::addMessage('Another message', 'mylabel');
以下のように出力されます。
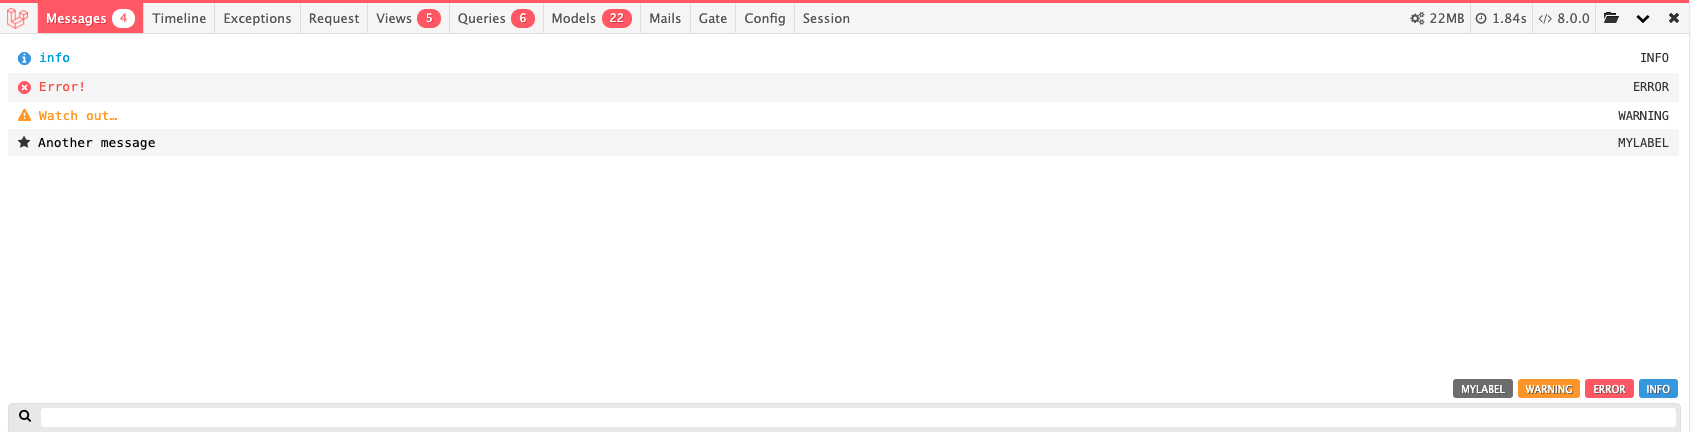
右下のアイコンをクリックすることで、ログの種類によって絞り込みができます。
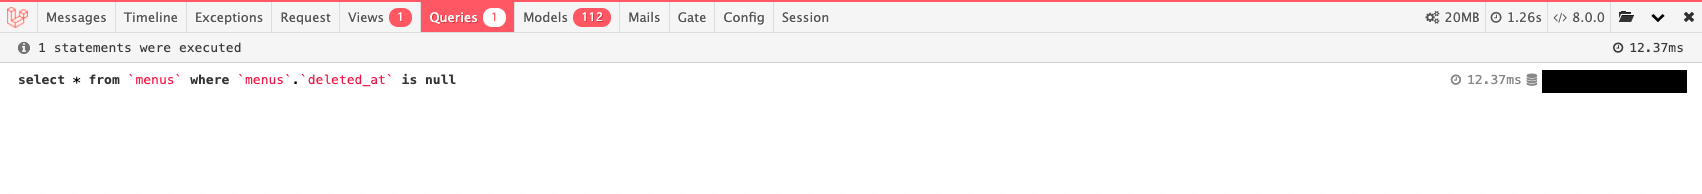
Queries
実行されたクエリが確認できます。
クエリの実行にかかった時間や重複したクエリが実行されている場合は強調表示されます。
Views
表示しているページで使用しているbladeファイルの一覧が確認できます。
config/debugbar.php のoptions を以下のように設定することでviewに渡されているパラメータを確認することができるようになります。
'options' => [
    ...
    'views' => [
        ...
        'data' => true,    //Note: Can slow down the application, because the data can be quite large..
    ],
]
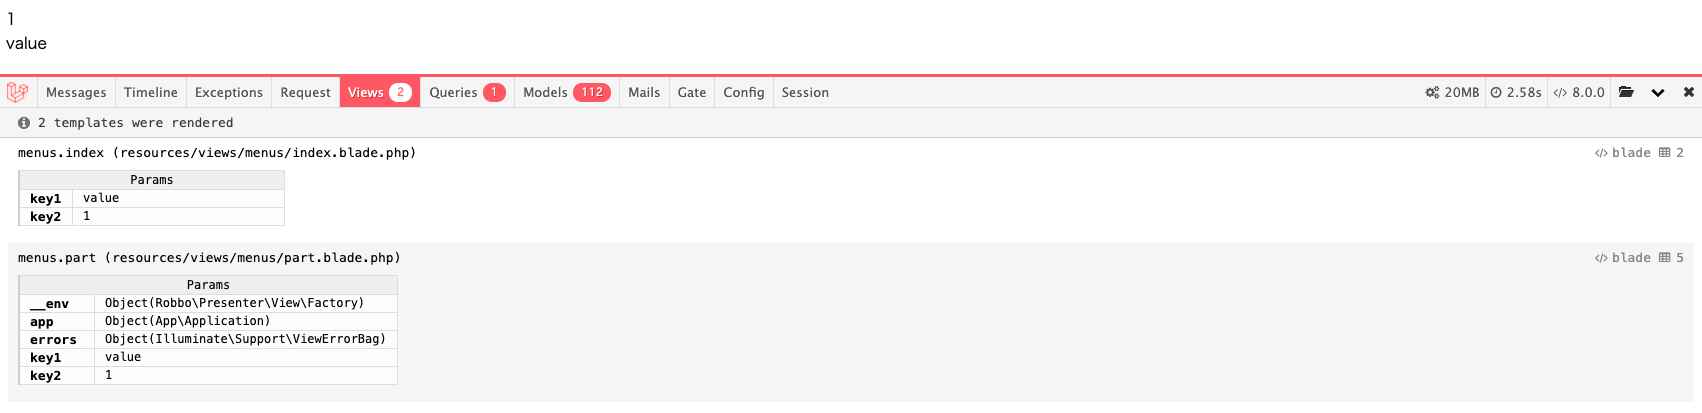
簡単な例でパラメータの確認をしてみます。
public function index()
{
    return view('menus.index', ['key1' => 'value', 'key2' => 1]);
}
@include('menus.part')

<div>{{ $key1 }}</div>
<div>{{ $key2 }}</div>
このようなアクションとbladeファイルがあったとすると以下の画像のように確認できます。
それぞれのviewファイルに渡されているパラメータを確認することができますが、オブジェクトの詳細まで確認することはできないようでした。
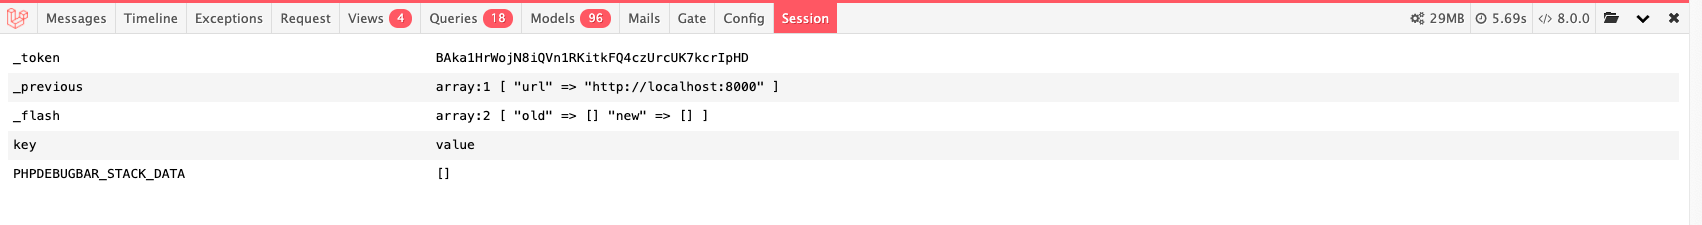
Session
セッションの値を確認できます。
session()->put('key', 'value');