[chartJS2.4][円グラフ]ツールチップの表示箇所を変えたい
表題のとおりです。
グラフを出すときに、ツールチップを常に表示し、表示位置と表示内容を変えたい問題に遭遇しました。
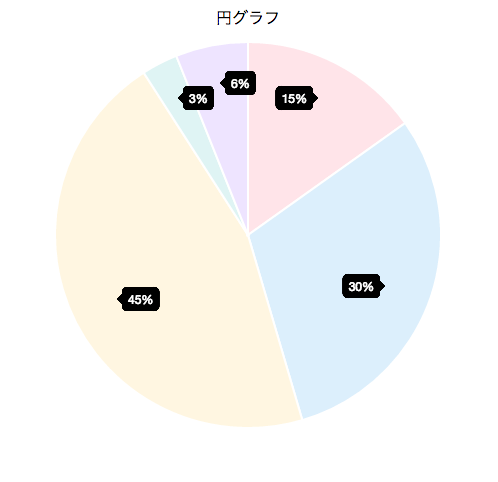
目標:
現実:
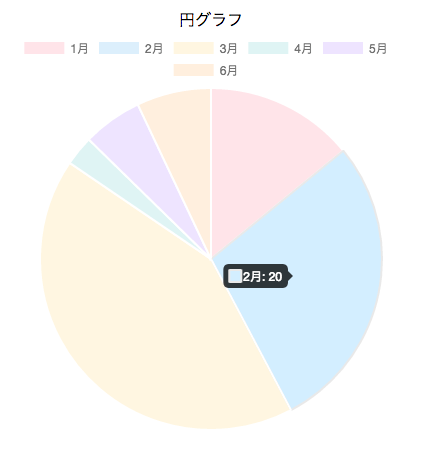
(デフォルトでは、マウスホバーすると、ツールチップが表示される。)
ということで、実装してみました。
ラベルが消えたのは、大人の事情です。(めんどくさかっただけ)
もったいぶっても仕方ないので、僕が見つけた全てをサンプルコードとして貼っておきます。
サンプルコード
index.html
<!DOCTYPE html>
<html>
<head>
  <meta charset="utf-8">
  <title>chart js</title>
</head>
<body>
  <div style="float: left; width: 400px; height: 400px">

  </div>
  <div style="float: left; width: 400px; height: 400px;">
    <div style="text-align: center;">
      円グラフ
    </div>
    <canvas id="pie"></canvas>
  </div>
  <script src="https://code.jquery.com/jquery-2.2.4.min.js"></script>
  <script src="https://cdnjs.cloudflare.com/ajax/libs/Chart.js/2.4.0/Chart.min.js"></script>
  <script src="./pie.js"></script>
</body>
</html>
pie.js
$(function(){

  var each = [11,12,13,14,15,21,22,23,24,25];

  $.each(each, function(i, val) {

    var array = [10, 20, 30, 2, 4];
    var labels = ['1月', '2月', '3月', '4月', '5月'];

    var lineChartData = {
      //   labels : label,
      datasets : [
        {
          strokeColor : "rgba(220, 220, 220, 1)",
          fillColor : "rgba(220, 220, 220, 0.5)",
          pointColor : "rgba(220, 220, 220, 1)",
          pointStrokeColor : "rgba(220, 220, 220, 1)",
          backgroundColor: [
            'rgba(255, 99, 132, 0.2)',
            'rgba(54, 162, 235, 0.2)',
            'rgba(255, 206, 86, 0.2)',
            'rgba(75, 192, 192, 0.2)',
            'rgba(153, 102, 255, 0.2)'
          ],
          data : array
        }
      ]
    };

    //http://stackoverflow.com/questions/36992922/chart-js-v2-how-to-make-tooltips-always-appear-on-pie-chart
    Chart.pluginService.register({
      beforeRender: function (chart) {
        if (chart.config.options.showAllTooltips) {
          // create an array of tooltips
          // we can't use the chart tooltip because there is only one tooltip per chart
          chart.pluginTooltips = [];
          chart.config.data.datasets.forEach(function (dataset, i) {
            chart.getDatasetMeta(i).data.forEach(function (sector, j) {
              chart.pluginTooltips.push(new Chart.Tooltip({
                _chart: chart.chart,
                _chartInstance: chart,
                _data: chart.data,
                _options: chart.options.tooltips,
                _active: [sector]
              }, chart));
            });
          });
          // turn off normal tooltips
          chart.options.tooltips.enabled = false;
        }
      },
      afterDraw: function (chart, easing) {
        if (chart.config.options.showAllTooltips) {
          // we don't want the permanent tooltips to animate, so don't do anything till the animation runs atleast once
          if (!chart.allTooltipsOnce) {
            if (easing !== 1)
            return;
            chart.allTooltipsOnce = true;
          }

          // turn on tooltips
          chart.options.tooltips.enabled = true;
          Chart.helpers.each(chart.pluginTooltips, function (tooltip) {
            tooltip.initialize();
            tooltip.update();
            // we don't actually need this since we are not animating tooltips
            // tooltip.pivot();
            tooltip.transition(easing).draw();
          });
          chart.options.tooltips.enabled = false;
        }
      }
    })
    Chart.Tooltip.positioners = {
      average: function(elements) {
        if (!elements.length) {
          return false;
        }

        var i, len;
        var x = 0;
        var y = 0;
        var count = 0;

        for (i = 0, len = elements.length; i < len; ++i) {
          var el = elements[i];
          if (el && el.hasValue()) {
            var pos = el.tooltipPosition();
            // pos.x が 100 以上 = 右側に表示 -> x に20 足して、干渉しないように。
            var length = Math.sqrt((pos.x - 200) ** 2 + (pos.y - 200) ** 2);
            if (pos.x >= 200 && pos.y >= 200) {
              x = 200 + 150 * (pos.x - 200) / length;
              y = 200 + 150 * (pos.y - 200) / length;
              //   x = pos.x;
            } else if (pos.x >= 200 && pos.y <= 200) {
              x = 200 + 150 * (pos.x - 200) / length;
              y = 200 + 150 * (pos.y - 200) / length;
            } else if (pos.x <= 200 && pos.y <= 200) {
              x = 200 + 150 * (pos.x - 200) / length;
              y = 200 + 150 * (pos.y - 200) / length;
            } else if (pos.x <= 200 && pos.y >= 200) {
              x = 200 + 150 * (pos.x - 200) / length;
              y = 200 + 150 * (pos.y - 200) / length;
            }
            ++count;
          }
        }
        return {
          x: Math.round(x / count),
          y: Math.round(y / count)
        };
      }
    };


    var option = {};
    var ctx = document.getElementById('pie').getContext('2d');

    /** global: Chart */
    var chart = new Chart(ctx, {
      type: 'pie',
      data: lineChartData,
      options: {
        animation: false,
        bezierCurve : false,
        onAnimationComplete: false,  /// calls function done() {} at end
        showAllTooltips: true,
        displayColors: false,
        tooltips:{
          callbacks: {
            label: function(tooltipItem, data) {
              //get the concerned dataset
              var dataset = data.datasets[tooltipItem.datasetIndex];
              //calculate the total of this data set
              var total = dataset.data.reduce(function(previousValue, currentValue, currentIndex, array) {
                return previousValue + currentValue;
              });
              //get the current items value
              var currentValue = dataset.data[tooltipItem.index];
              //calculate the percentage based on the total and current item, also this does a rough rounding to give a whole number
              var percentage = Math.floor(((currentValue/total) * 100)+0.5);

              return percentage + '%';
            }
          }
        }
      },
    });
  })
})
課題は2つありました。
ポイント1. ツールチップを常に表示する。
ポイント2. ツールチップの表示内容を変える。
ポイント3. ツールチップの表示位置を変える。
解決策
ポイント1: ツールチップを常に表示する
Stack Overflow
に答えが書いてありました。
Thank you very much.
オプションに showAllTooltips: true を入れるのを忘れないように気をつけてください。
ポイント2: ツールチップの表示内容を変える。
        tooltips:{
          callbacks: {
            label: function(tooltipItem, data) {
              //get the concerned dataset
              var dataset = data.datasets[tooltipItem.datasetIndex];
              //calculate the total of this data set
              var total = dataset.data.reduce(function(previousValue, currentValue, currentIndex, array) {
                return previousValue + currentValue;
              });
              //get the current items value
              var currentValue = dataset.data[tooltipItem.index];
              //calculate the percentage based on the total and current item, also this does a rough rounding to give a whole number
              var percentage = Math.floor(((currentValue/total) * 100)+0.5);

              return percentage + '%';
            }
          }
で実装しています。
Chart.js 2系では、このように callback を使って設定を書くようです。
ぐぐると、1系の書き方が多く出てきます。 tooltipTemplate で書く方法とかが出てきますが、うまく行きません。
ちなみに、この書き方もどこかを参考にさせていただきましたが、どこだったか忘れてしまいました。すみません。
リンク見つけたら更新しておきます。
ポイント3: ツールチップの表示位置を変える。
これは、残念ながらサンプルがなかったので、自力で実装しました。
といっても、 Chart.Tooltip.positioners を拡張しただけです。(探すのに超時間かかった。。。)
Chart.Tooltip.positioners が、ツールチップをどこに表示するかを決めているみたいだったので、
x とか y の値を変更してあげました。
ちなみに、上記の実装では、ツールチップ表示位置の半径を変更しています。
この他にも、色々やりようはありそうです。
ということで、 chart.js で
ツールチップを常に表示し、表示位置と表示内容を変えたい
場合の対処法でした。
終わりに
ポイント3: ツールチップの表示位置を変える。
における、計算に関する苦情は受け付けません。
が、ご指摘は大歓迎です。
今回は 200 で決め打ち(目標: の画像でラベルを消したのは、このため)していますが、中央と半径をうまく取得する方法もあるはずです。
頑張ればもう少しちゃんと書けそう!!