Pythonで地理情報を可視化できるfoliumというライブラリを見つけたので、ざっくりと使い方をまとめます。
実行環境
- Python 3.9.13
- macOS 12.6.8
データの準備
最近暑かったので今回は気象庁の気温データを可視化してみます。
- 気温データ
気象庁([https://www.data.jma.go.jp/gmd/risk/obsdl/index.php:title])から各都道府県庁所在地の最高気温をとってきて↓みたいな感じに整形しておきます。
kion.csv
| 北海道 | 青森県 | 岩手県 | ... | 宮崎県 | 鹿児島県 | 沖縄県 | |
|---|---|---|---|---|---|---|---|
| 2023/6/1 | 24.7 | 26.5 | 24.1 | ... | 21.1 | 24.4 | 26.6 |
| 2023/6/2 | 21.9 | 20.0 | 19.3 | ... | 23.4 | 27.9 | 26.5 |
| ... | ... | ... | ... | ... | ... | ... | ... |
- 都道府県コード
都道府県名と都道府県コードの対応辞書です。
pref_code = {
    "北海道": 1,
    "青森県": 2,
    "岩手県": 3,
    ...,
    "宮崎県": 45,
    "鹿児島県": 46,
    "沖縄県": 47
}
- 都道府県のシェイプデータ
都道府県の形を地図上に描画するときの形状データです(多分)。
↓のコマンドでダウンロードしておきます。
curl https://raw.githubusercontent.com/dataofjapan/land/master/japan.geojson > japan.geojson
- 都道府県庁所在地の緯度経度データ
各都道府県庁所在地の緯度経度が記録されているデータです。
latlon.csv
| pref | lon | lat |
|---|---|---|
| 北海道 | 141.3469444 | 43.06444444 |
| 青森県 | 140.74 | 40.82444444 |
| 岩手県 | 141.1527778 | 39.70361111 |
| ... | ... | ... |
地図を作成
必要なライブラリのインポート
import folium
from folium.plugins import HeatMap
import pandas as pd
コロプレス図を作る
まずは特定の日付の最高気温をコロプレス図(タイル形式でのヒートマップ)で描画してみます。
# 気温データの読み込みと都道府県コードへの変換
kion = pd.read_csv('kion.csv', index_col=0)
kion.columns = map(lambda x: pref_code[x], kion.columns)

# 描画対象の日付
date = '2023/8/1'

# 地図の基準
m = folium.Map(location=[35, 135], zoom_start=5)
m.choropleth(
    geo_data='japan.geojson',
    data=kion.loc[date].T.reset_index(),
    columns=kion.loc[date].T.reset_index().columns,
    key_on='feature.properties.id',
    threshold_scale=range(25,40),
    fill_color='YlOrRd',
    reset=True
)
# 地図をhtml形式で出力
m.save(outfile='map.html')
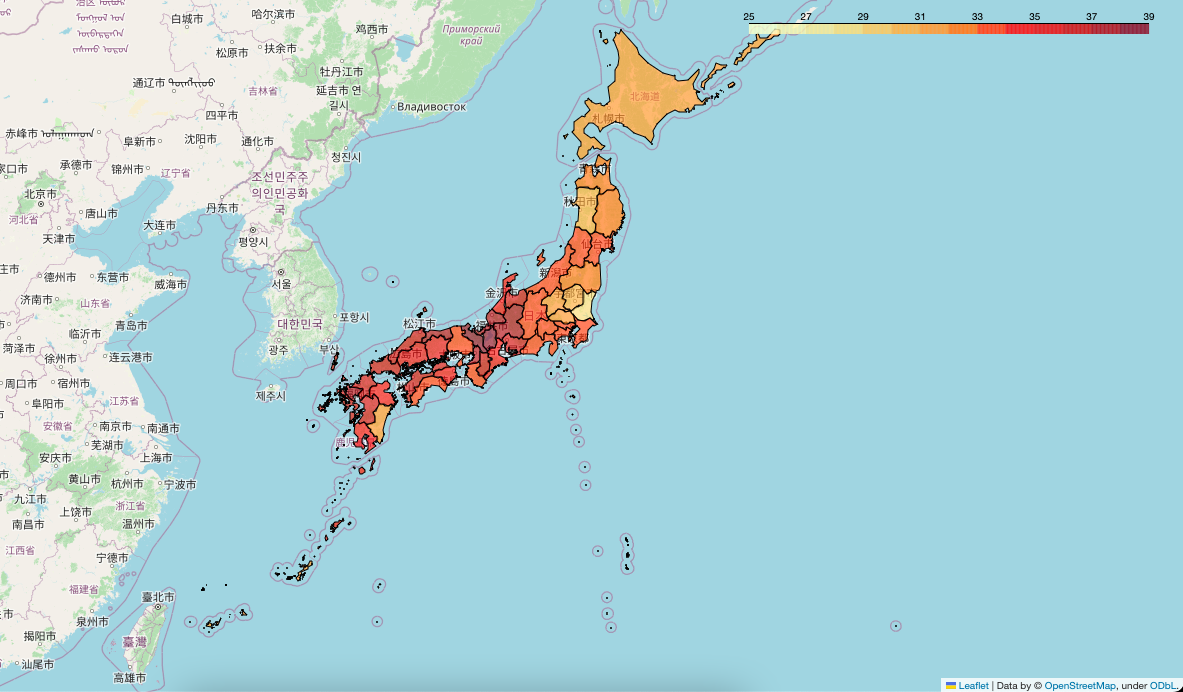
出力されたHTMLをブラウザで表示するとこんな感じ。
地図データにはOpenStreetMapを使っているんですね。
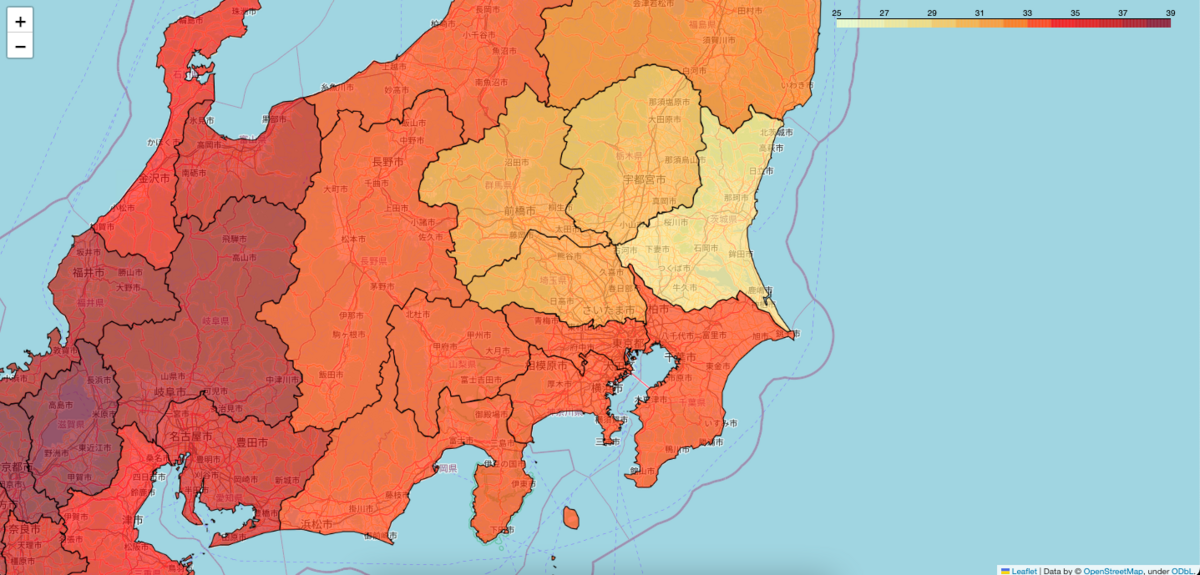
HTML形式なので、ブラウザ上でスクロールやズームもできます。
茨城が涼しいんですね。
ヒートマップを作る
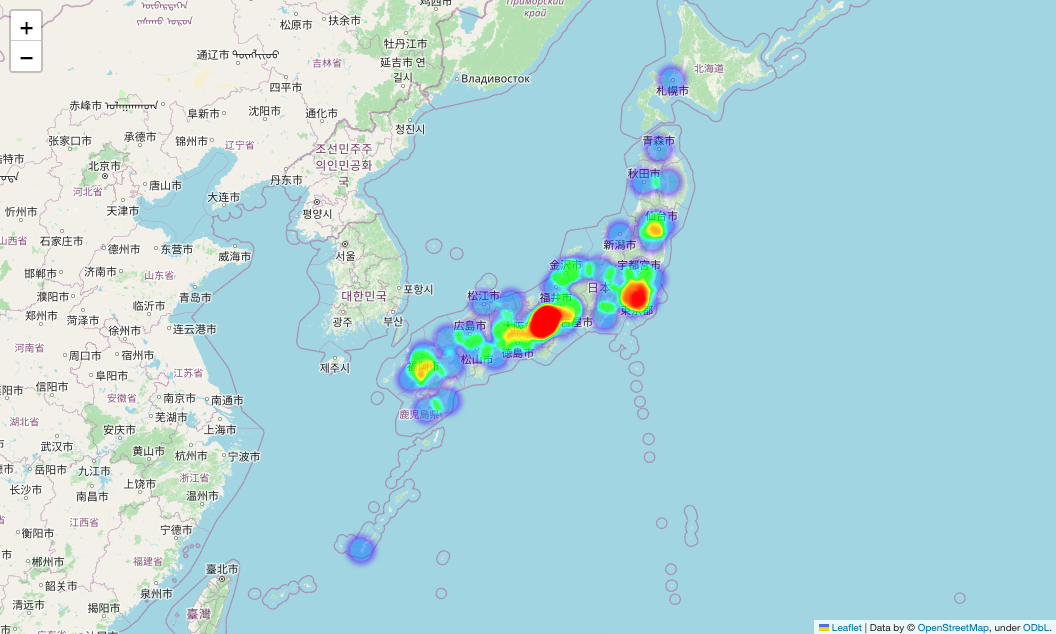
次に点データの値の大きさをヒートマップで表示します。
点座標は都道府県庁所在地、値の大きさはその日の最高気温にします。
# 描画対象の日付
date = '2023/8/1'

# 緯度経度と最高気温を結合
latlon = pd.read_csv('latlon.csv', index_col=0)
kion = pd.read_csv('kion.csv', index_col=0)
kion = pd.concat([latlon, kion.T], axis=1).copy()
kion = kion[['lat', 'lon', date]].values.tolist()

# 地図の基準
m = folium.Map(location=[35, 135], zoom_start=5)
hm = HeatMap(
    kion,
    radius=15,
    blur=5
).add_to(m)
hm.add_to(m)
m.save(outfile='map.html')
東京や名古屋あたりが目立って暑そうに見えますが、都道府県庁所在地が密集しているせいですね。
動くヒートマップを作る
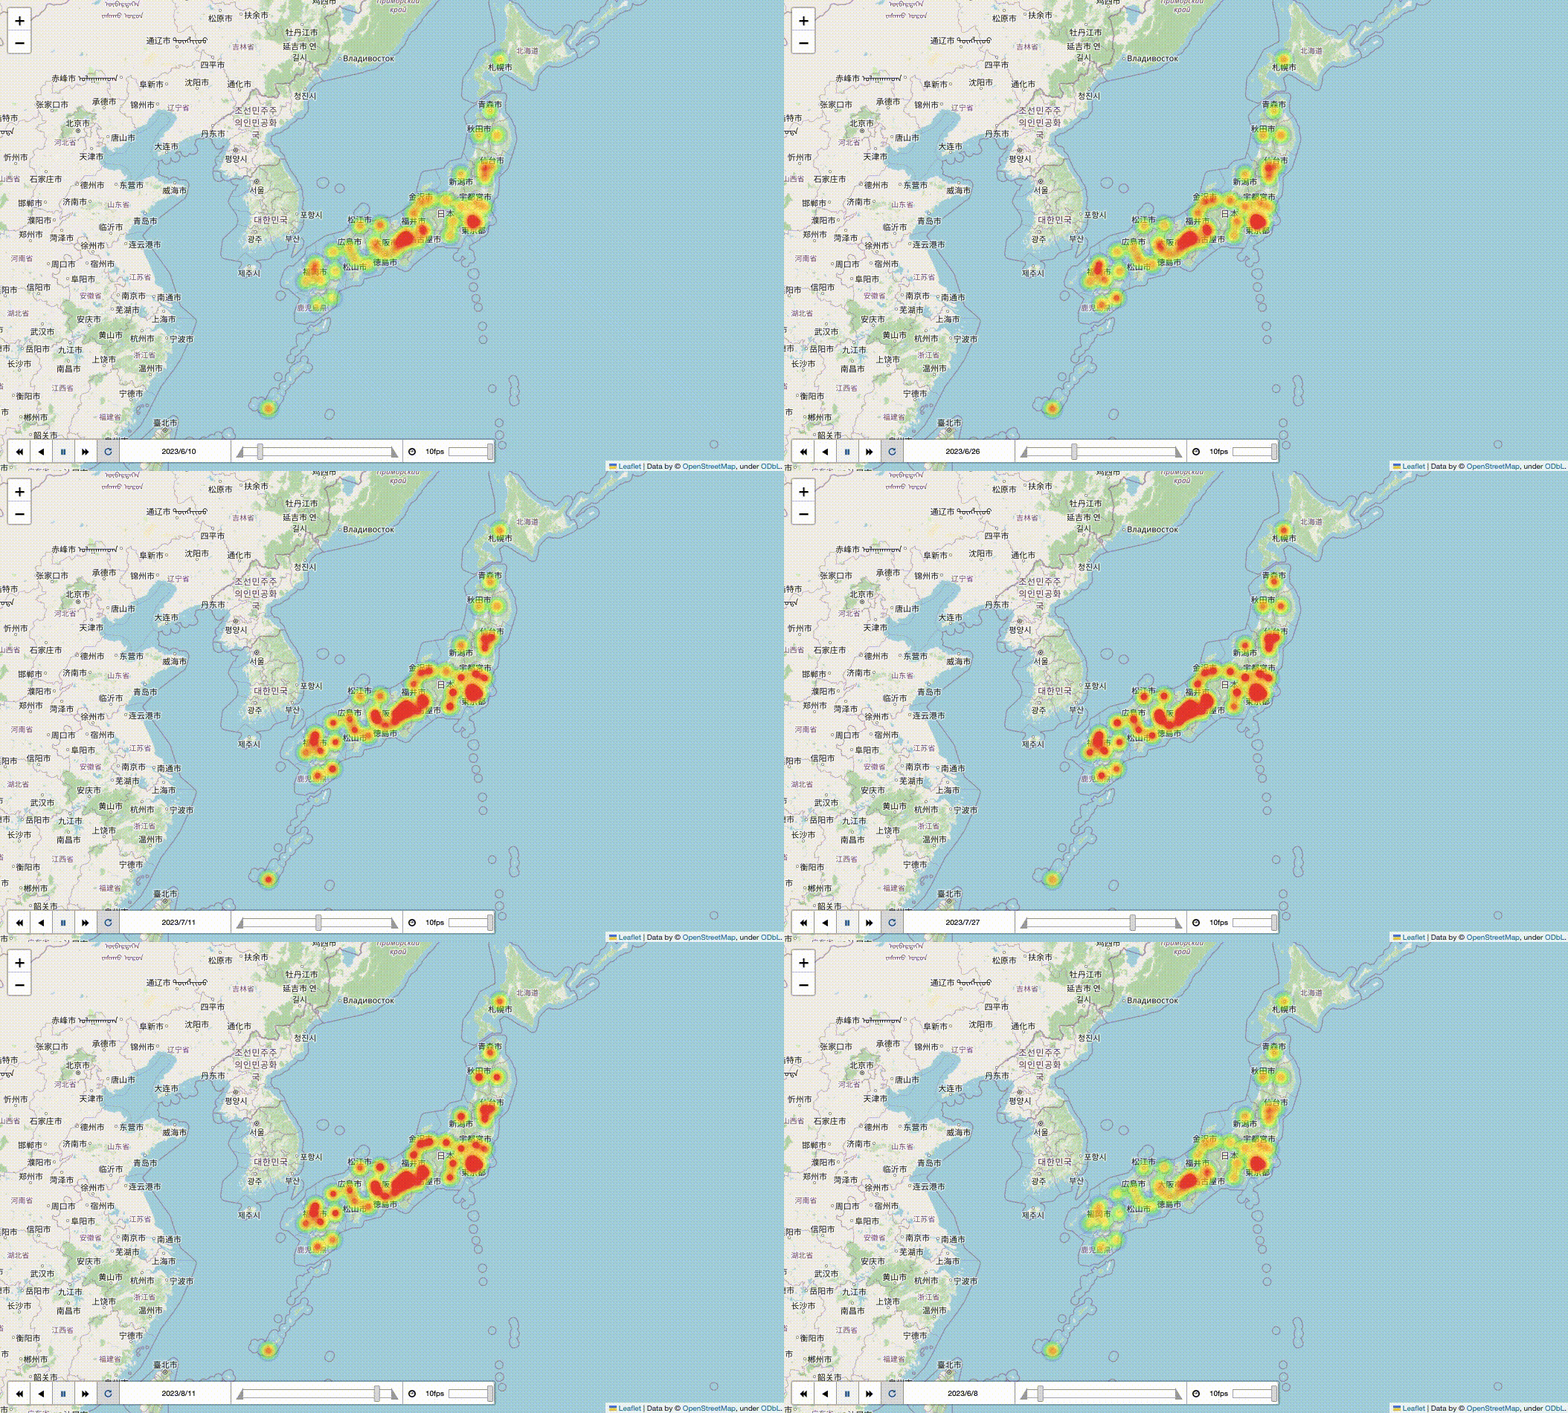
時系列で変化する点データを動かして可視化します。
ひとつ前のものと同じように点座標は都道府県庁所在地、値の大きさは最高気温にします。
そしてこれを日付変化で見られるようにします。
# 時系列の気温データの作成
latlon = pd.read_csv('latlon.csv', index_col=0)
kion = pd.read_csv('kion.csv', index_col=0) / 40
latlon_kion = [
    pd.concat([latlon[['lat', 'lon']], kion.loc[[date]].T], axis=1).values.tolist()
    for date in kion.index
]

# 地図の基準
m = folium.Map(location=[35, 135], zoom_start=5)
hm = folium.plugins.HeatMapWithTime(
    latlon_kion,
    index=kion.index.tolist(),
    auto_play=False,
    radius=16,
    max_opacity=1,
    gradient={0.1: 'blue', 0.25: 'lime', 0.5:'yellow',0.75: 'orange', 0.9:'red'}
)
hm.add_to(m)
m.save(outfile='map.html')
良い感じになりました。


