Electron の デバッグ実行
ElectronのProcessはMain Process, Renderer Processの二種類あります。
Visual Studio Codeのデバッグ機能でMain ProcessとRenderer Processデバッグ実行が可能です。
Main Process でのデバッグ実行
Electron の Main Process でのデバッグ実行は下記の資料が参考になります。
こちら
nodejsデバッグの基本設定で実現できます。
launch.jsonに設定追加
{
    "name": "Debug Main Process",
    "type": "node",
    "request": "launch",
    "cwd": "${workspaceRoot}",
    // "runtimeExecutable": "${workspaceRoot}/node_modules/.bin/electron",
    // Use the following for Windows
    "runtimeExecutable": "${workspaceRoot}/node_modules/.bin/electron.cmd",
    "program": "${workspaceRoot}/main.js"
}
Render Process でのデバッグ実行
Render Processは画面のレンダリングを担うProcessで、Electronのコードの多数がこのProcessで実行されるので、Render Processでデバッグ実行ができれば結構役に立ちます。
Render Processでデバッグ実行する方法は下記の英文資料で紹介されました。
こちら
原理
Electronには実行フラグ(launch flag) --remote-debugging-portがあり、リモートデバッグのポートを指定できます。こちらのポートでChrome Debugging Protocolが利用できます。
Visual Studio Codeではこれを扱う拡張Debugger for Chromeがあります。
設定
main.js編集
下記の内容を無効にします。
mainWindow.webContents.openDevTools()
Debugger for Chromeインストール
Visual Studio Codeの拡張機能ビューでdebugger-for-chromeをインストールします。
launch.jsonに設定追加
{
  "version": "0.2.0",
  "configurations": [
    {
      "name": "Debug Renderer Process",
      "type": "chrome",
      "request": "launch",
      "runtimeExecutable": "${workspaceRoot}/node_modules/.bin/electron",
      // Use the following for Windows
      // "runtimeExecutable": "${workspaceRoot}/node_modules/.bin/electron.cmd",
      "runtimeArgs": [
        "${workspaceRoot}/main.js",
        "--remote-debugging-port=9222"
      ],
      "webRoot": "${workspaceRoot}"
    }
  ]
}
Windows環境ではruntimeExecutableは${workspaceRoot}/node_modules/.bin/electron.cmd
非Windows環境は${workspaceRoot}/node_modules/.bin/electron
Debugger for Chrome関連設定で
ポートは通常9222で、
webRootはアプリフォルダーを指定します。
実行
サンプルコードは
こちらに
Visual Studio CodeのデバッグビューでDebug Renderer Process設定で実行します。
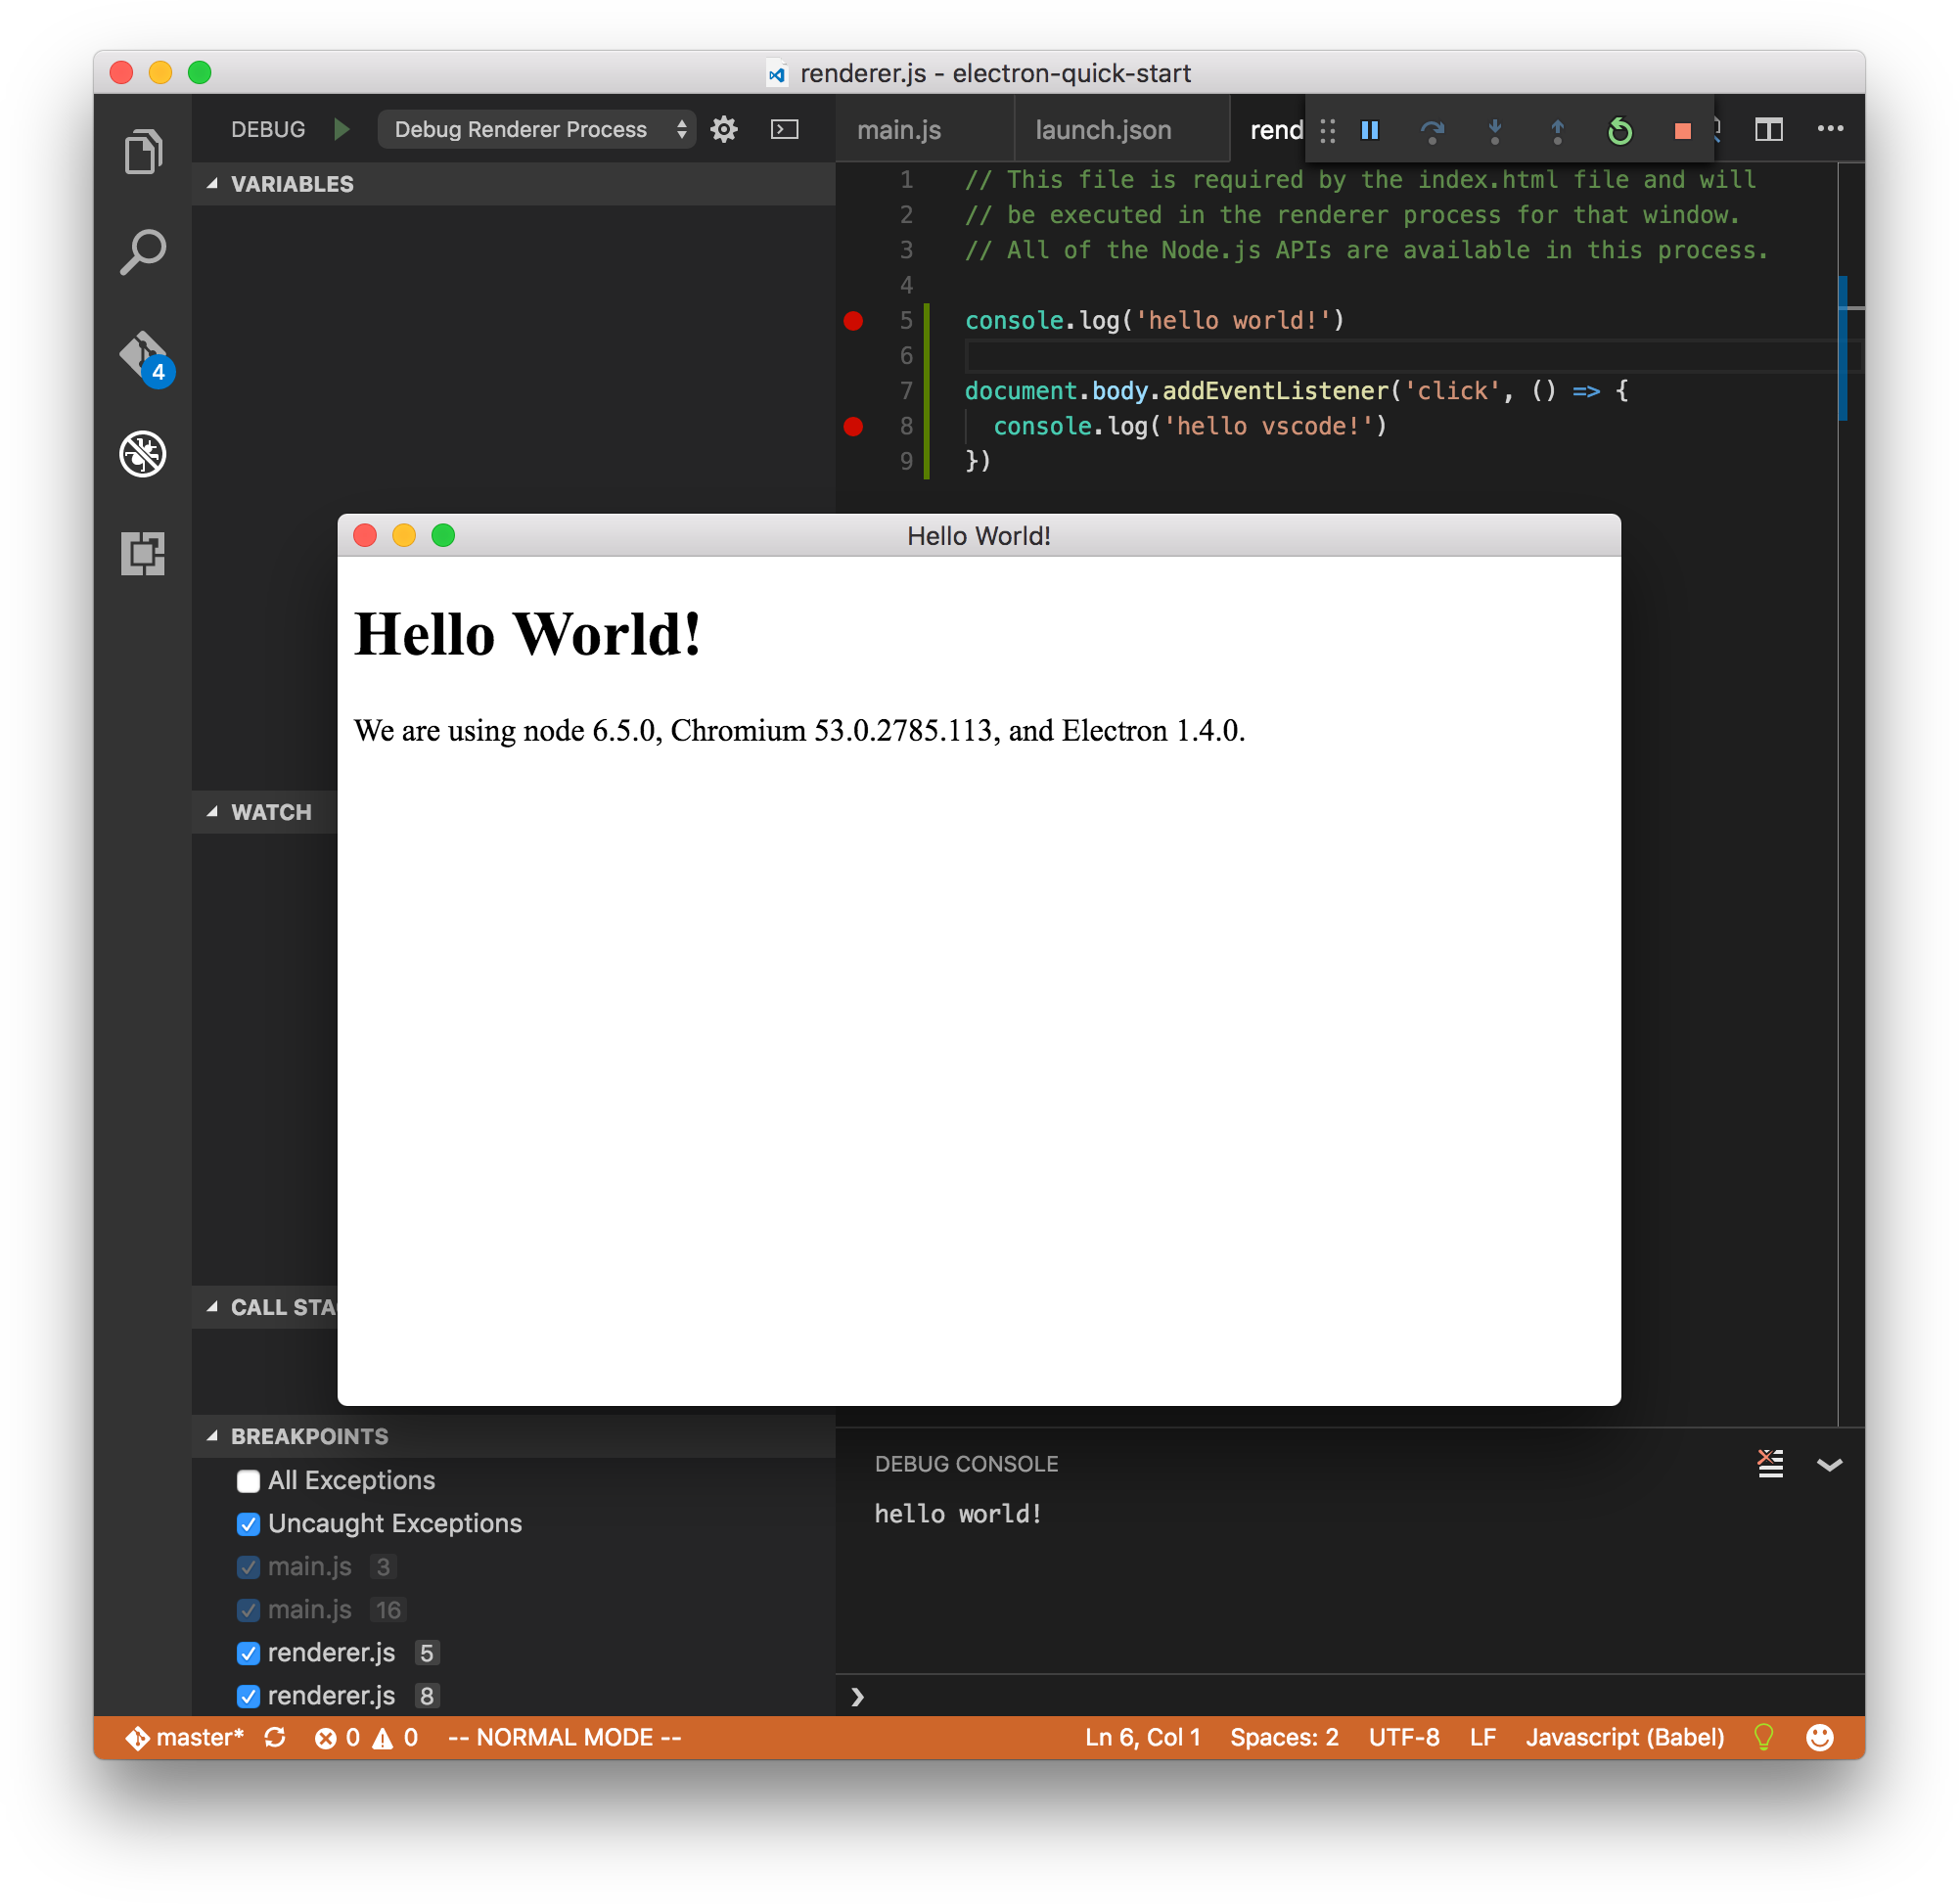
一回目は一つ目のconsole.log関数にあるブレークポイントは発動しなく、一回クリックするとclickイベント内二つ目のconsole.log関数にあるブレークポイントが発動します。
また、cmd/control+rで画面を再読み込みすると一つ目のconsole.log関数にあるブレークポイントが発動します。
以上
Electron の Renderer Process をデバッグ実行ができるようになりました。