はじめに
のつづきです。
前回の記事では、Thread.Sleep による遅延をプロファイラトレースを用いて特定しましたが、この記事では別のパターンも試してみます。
外部依存への遅延が発生しているパターン
実アプリではデータベースや、外部の API などを利用しているケースが多いと思います。
今回は、外部の Rest API を呼び出し、そこで遅延しているパターンを見てみます。
https://httpstat.us/ というサイトがあり、指定した時間だけ遅く応答を返してくれるので便利です。
呼び出し元の実装は以下の通り
Application Insights を見る
今回は HTTP リクエストを外部に投げているので dependency テーブルに記録されます。
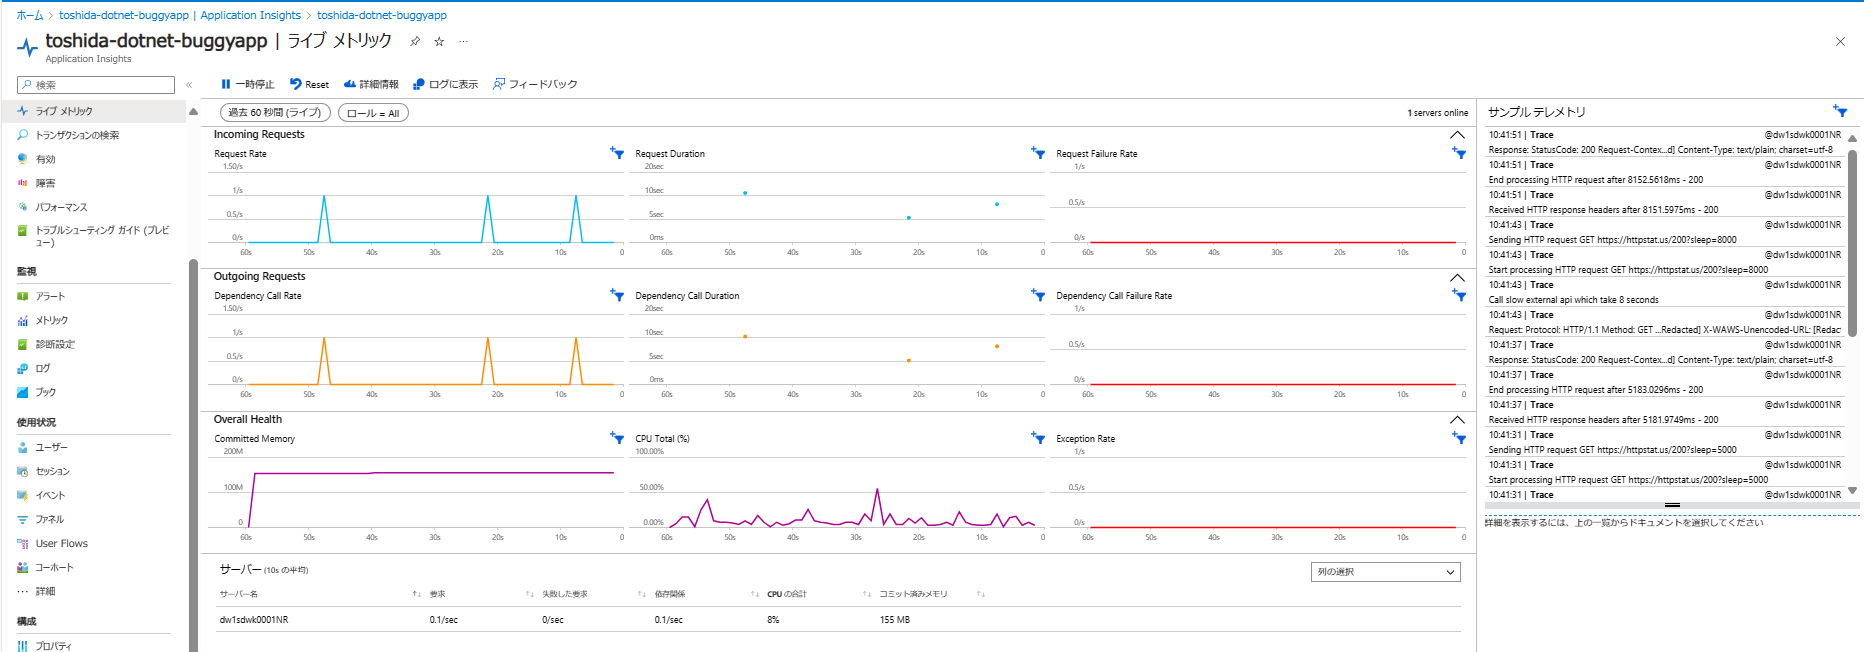
Live Metric
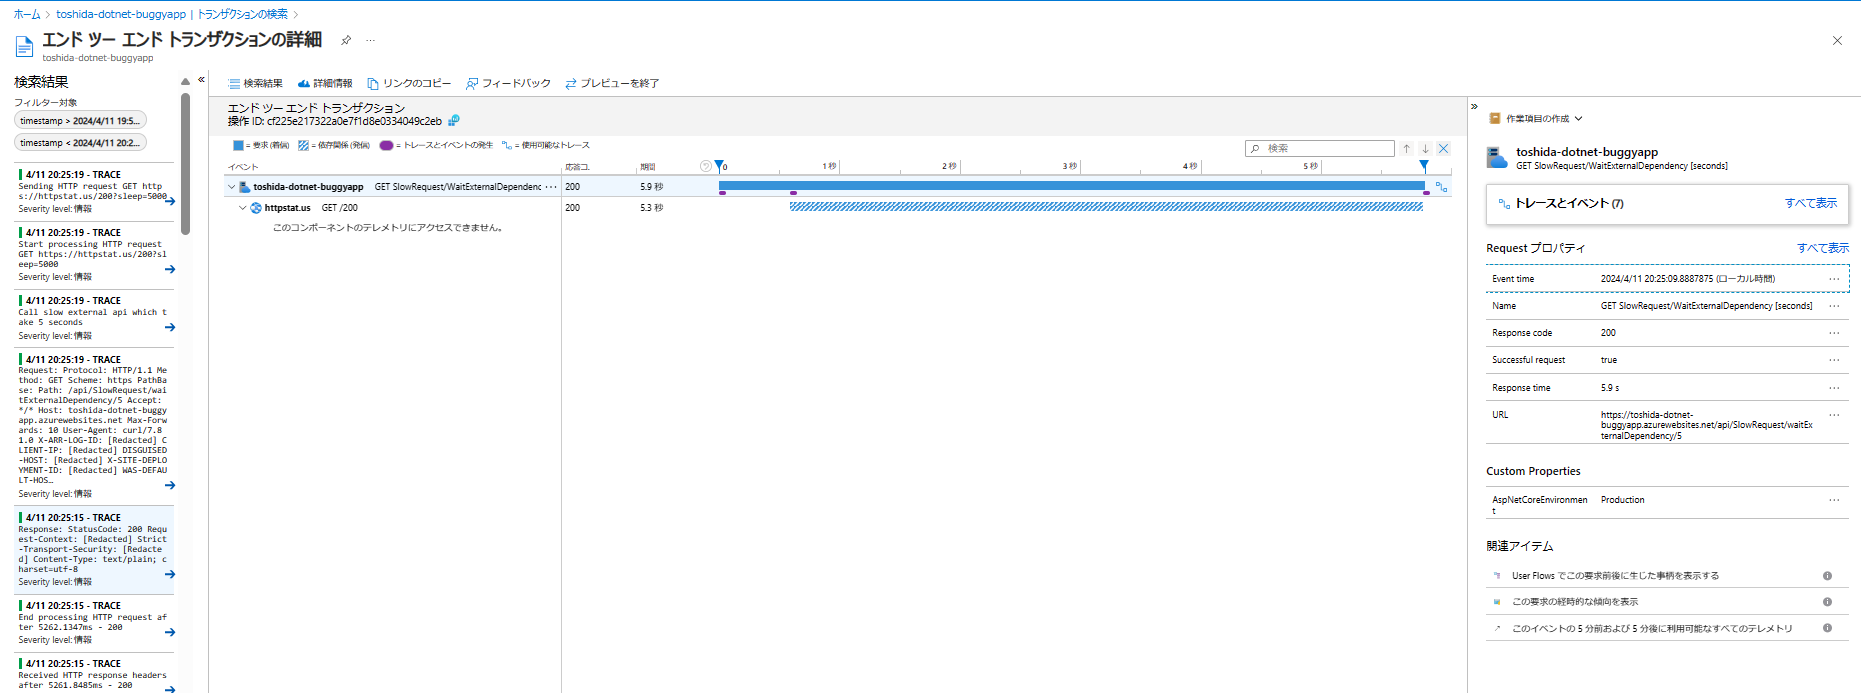
トランザクションの検索
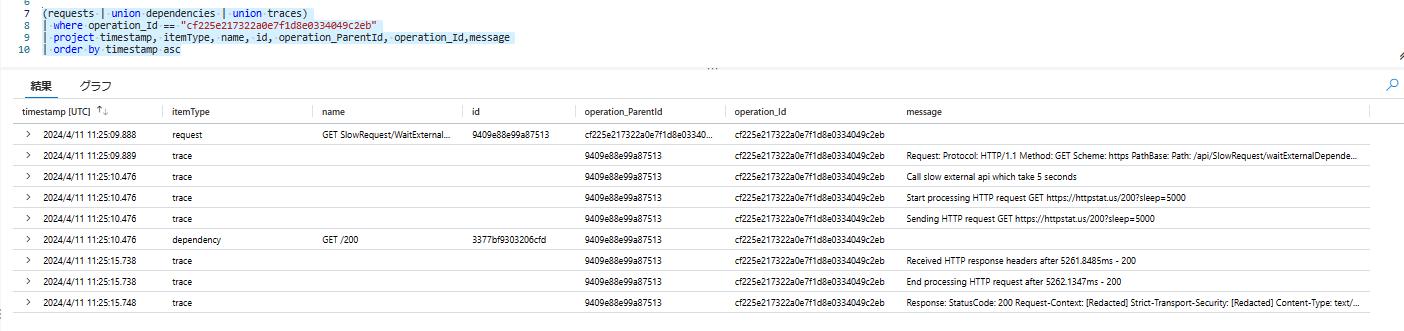
operation_Id
ログで見るなら operation_Id でまとめて見れます。
(requests | union dependencies | union traces)
| where operation_Id == "cf225e217322a0e7f1d8e0334049c2eb"
| project timestamp, itemType, name, id, operation_ParentId, operation_Id,message
| order by timestamp asc
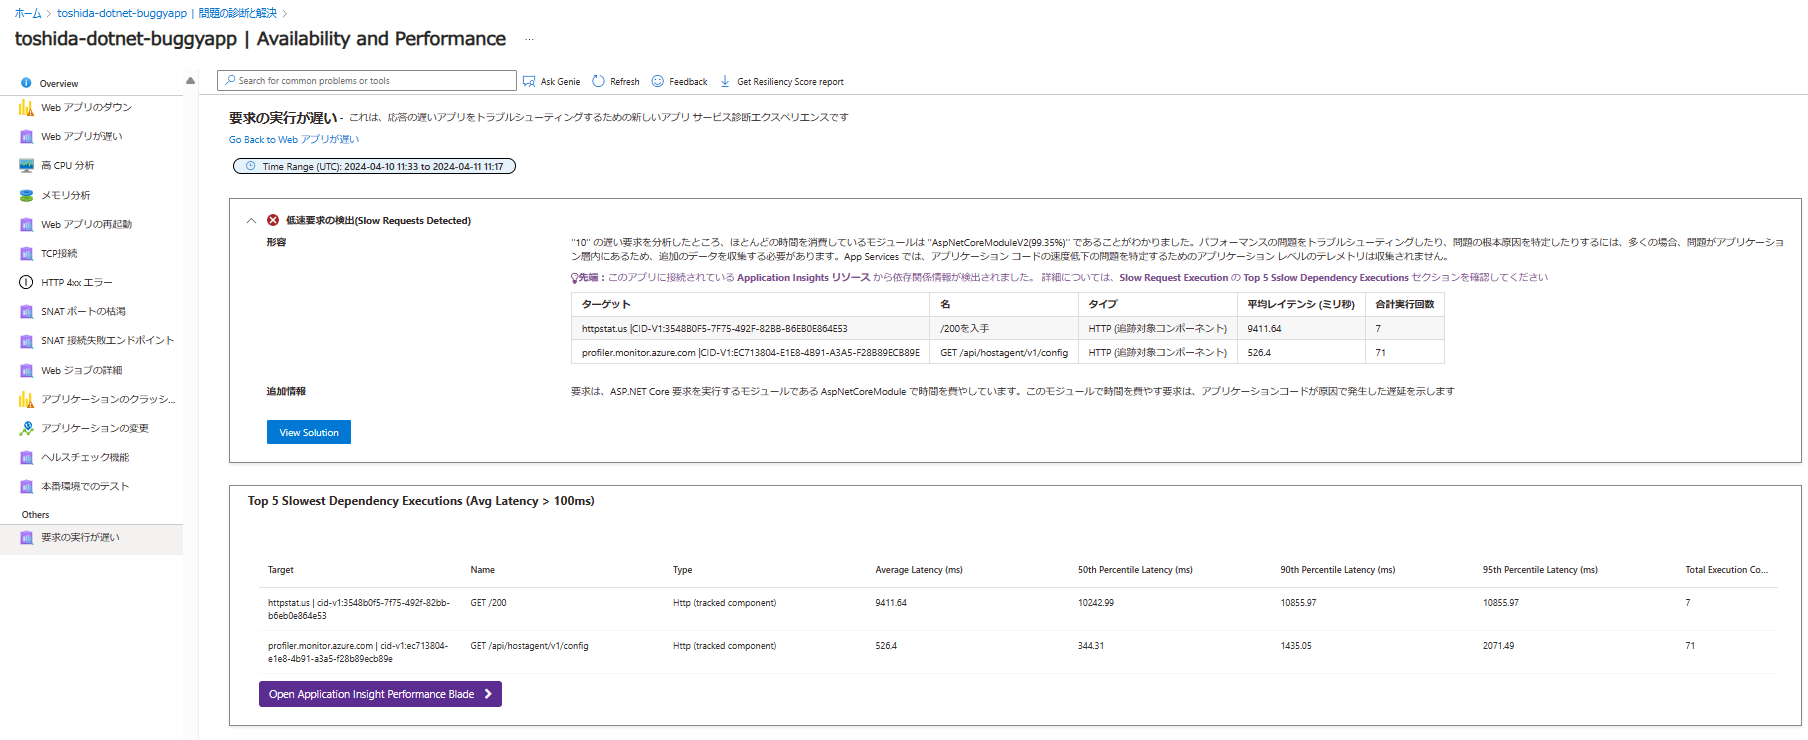
問題の診断と解決
Availability and Performance > 要求の実行が遅い
こちらも Application Insights の情報を引っ張ってきてくれてますね。
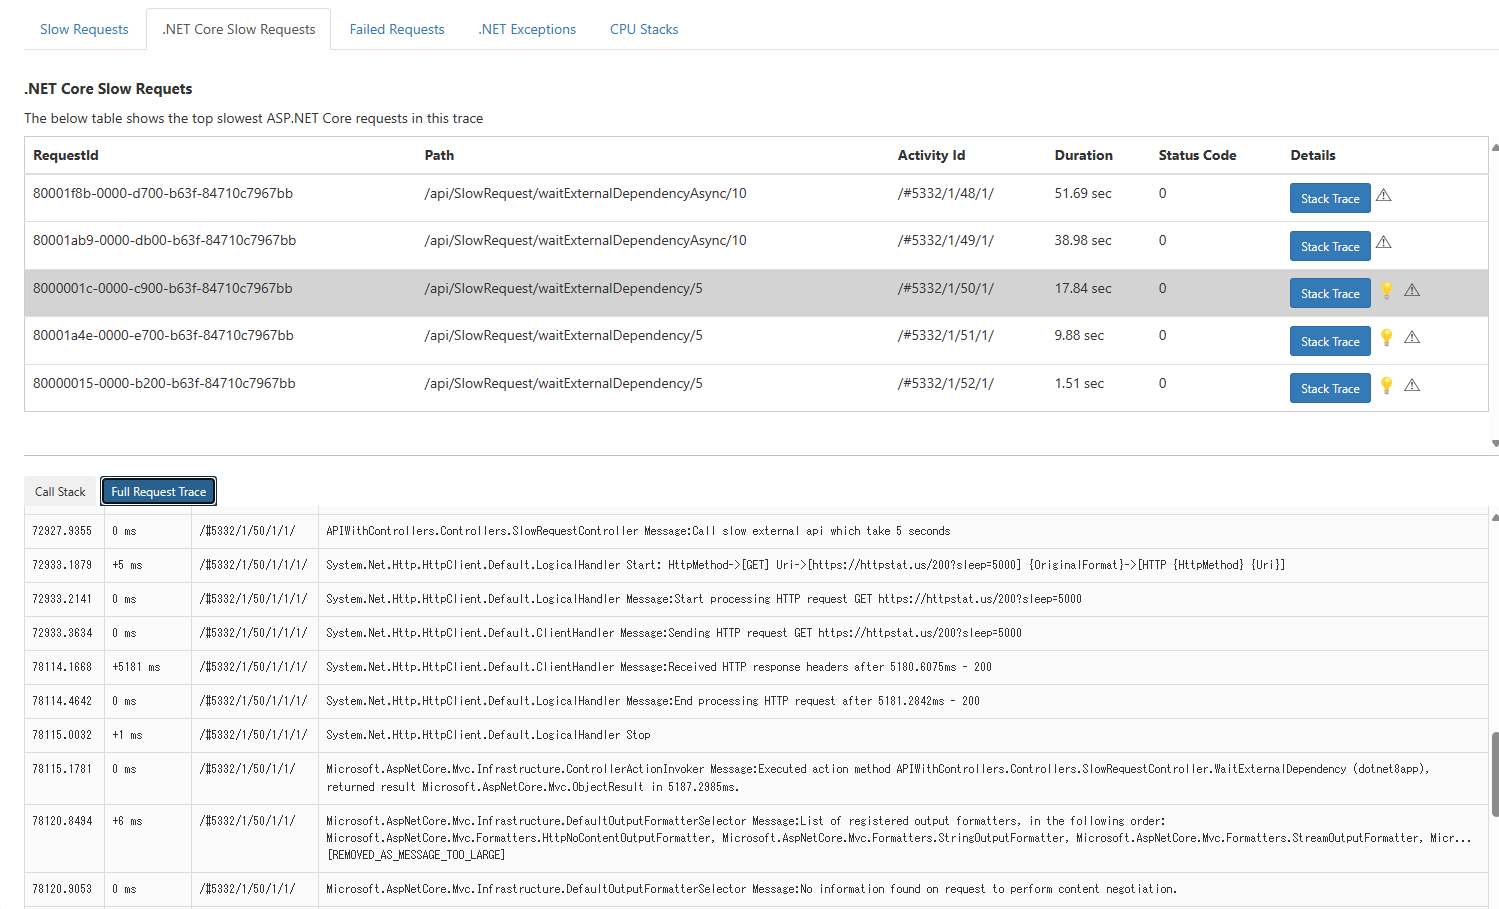
Diagnostic Tools >Collect .NET Profiler Trace
System.Net.Http.HttpClient.Default.ClientHandler Message:Sending から ystem.Net.Http.HttpClient.Default.ClientHandler Message:Received までで時間がかかっていることがわかりやすいですね。
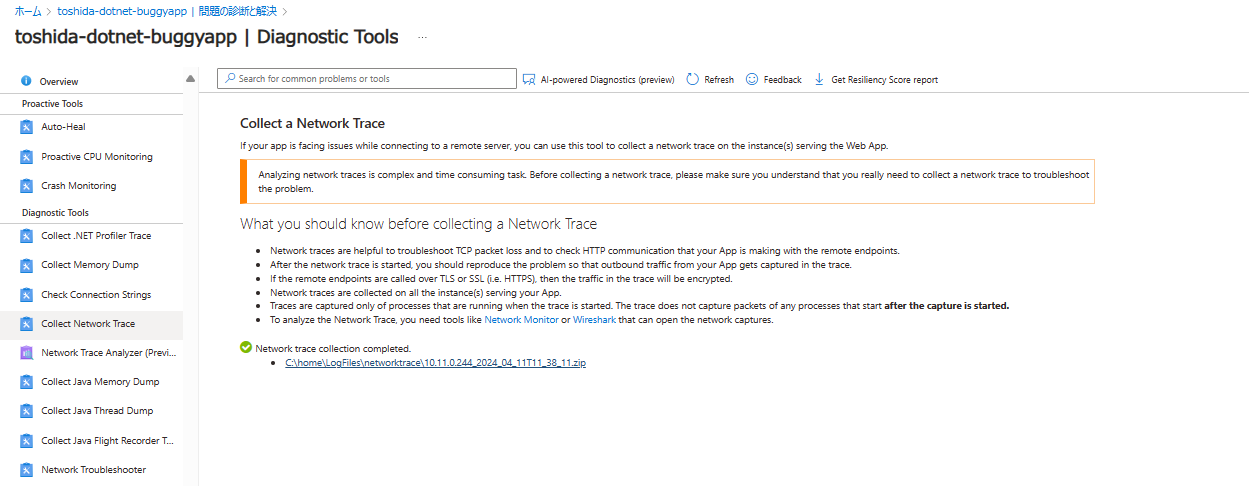
その他
今回は .Net アプリの遅延にスコープを当てているので対象外としますが、そもそも Connectivity の問題であれば、「Collect a Network Trace」や 「Network Troubleshooter」も活用できます。