まえがき
X,Y,Zからなる点群データ(数百MB~数GB)を格子データにして、ラスタファイル(GeoTIFF)にする処理を行う。文章が長いので、とりあえず末尾にあるコードを走らせてみたほうが早いかも。
因みに本コードで登場するクラスは機能を最小に絞った簡略化版で、完全版はそのうちGitHubにでもあげる予定。(Python 2.x→3.xへの転換が追いついていないため)
方針
今回の実装は、マルチビーム測深で得られた海底地形データを前提に以下を制約条件とした。
- インプットデータはメモリに格納しないこと (3.7GBあるため)
- 品質よりも速度を優先 (地形では大抵これで十分)
- 臨機応変に一手間二手間加えられる拡張性 (Pythonで書いた理由)
格子データにするアルゴリズム
点群データを格子状にする方法は最近傍法・距離加重法・クリギングなど多岐にわたる: 内挿法の比較—ヘルプ | ArcGIS Desktop
今回は、推定や重み付けをせずに格子内の点の平均を取るという最もシンプルな手法を使うことにする。速度とメモリ使用量の少なさが利点。
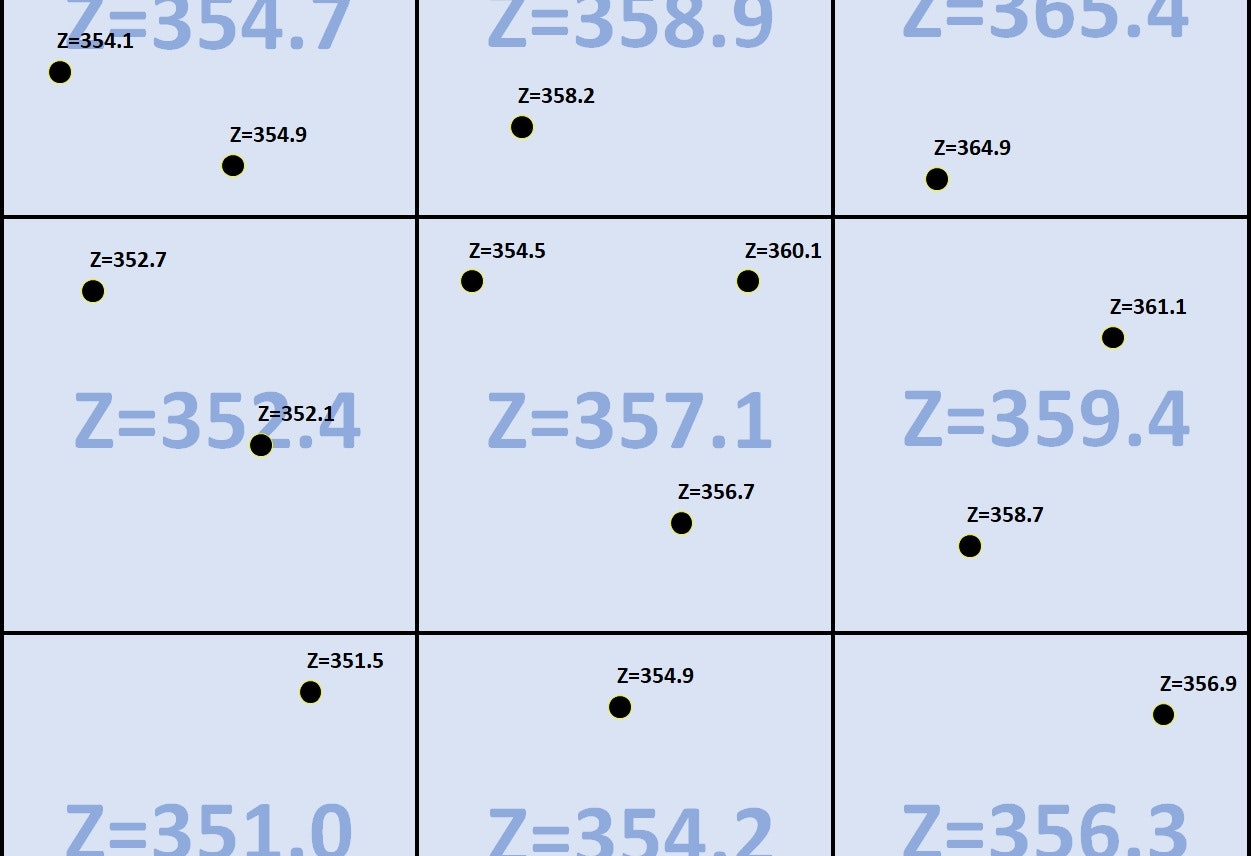
この手法では、メモリ内に2次元配列からなる格子データを2つ(Intensity:Z値の総和 と Density:点の数)保持しておくだけで良い。これらを逐次読み込んだ点群データで埋めていく。流石に時間がかかるが、メモリ8GBのPCで10000x10000の格子データを作ることも可能。
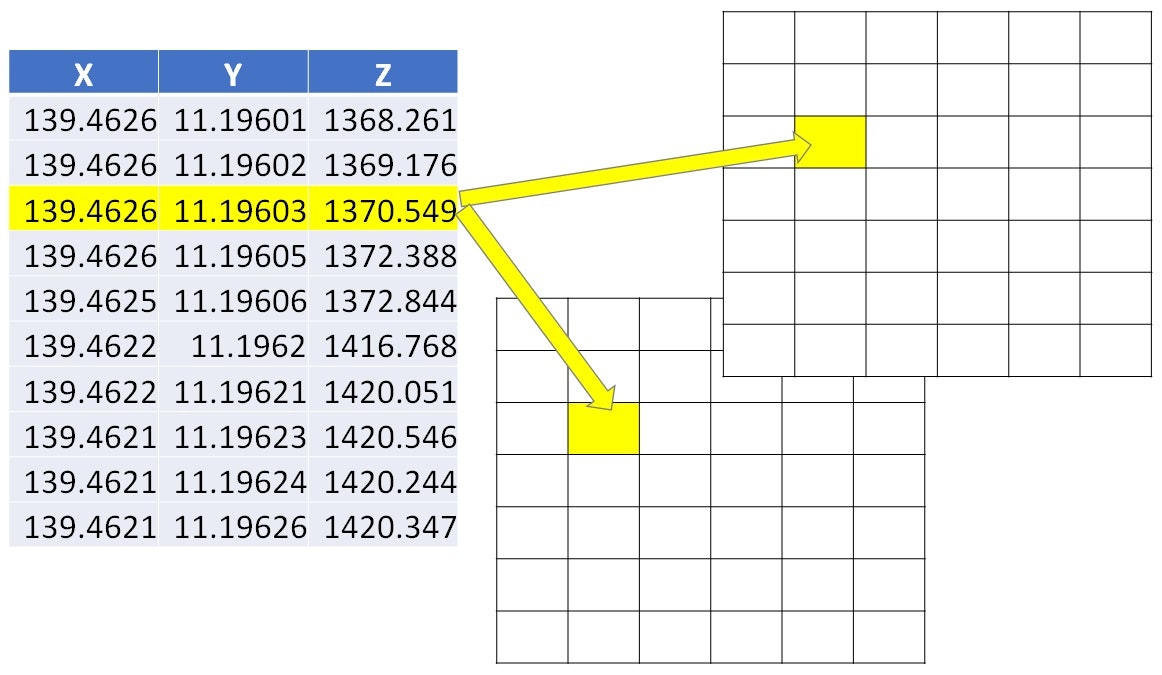
最終的に、この2つの2次元配列に対して以下のような演算を行うと格子状の地形データが手に入る。
(格子内の点のZ値の総和) / (格子内の点の数) = (格子内の平均Z値)
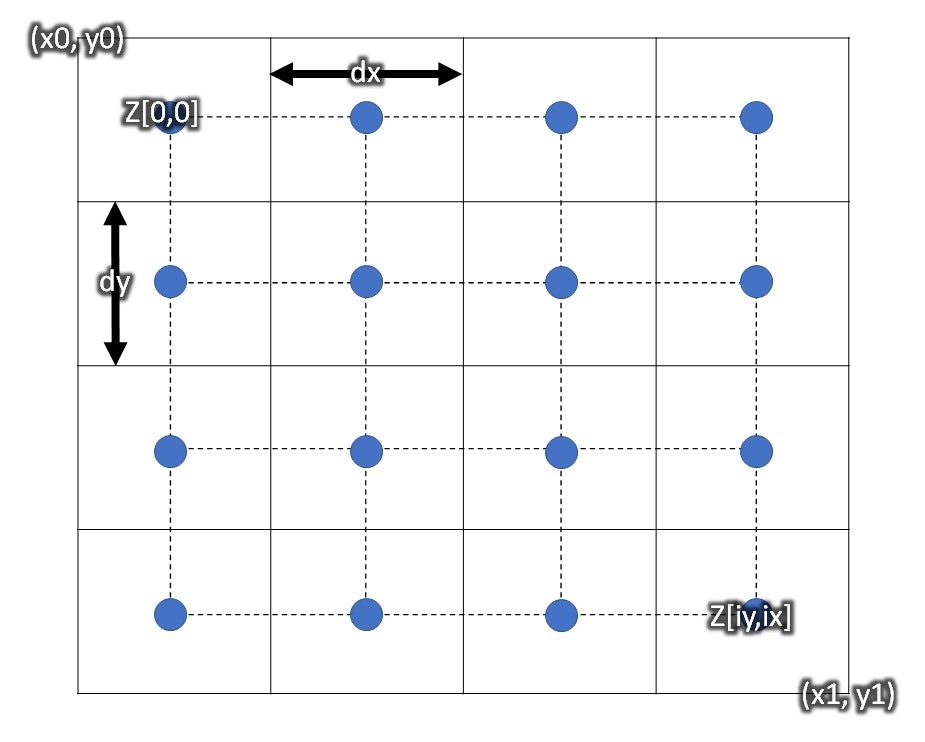
格子とノードの関係
格子データを作る際に最もややこしいポイント。
本コードではGDALのデータ構造に準拠させる関係上、ユーザーが定義するのは格子データの外枠と間隔ということになる。Z[iy,ix]としているのも同様の理由による。
IOの高速化
コードのclass PointCloudを見てもらえばわかるが 実は逐次読み込みではなく、一定のサイズのXYZブロックとして読み込んでいる。またリスト内表記で処理できるようにするため、IOをラッピングしたジェネレーターとして提供している。
これ以上高速化するには、IOとグリッドサーチを別プロセスでやることになりそう(がそこまでしたらPythonで書いた意味がないだろう)。
差別化
競合としてはGRASS GISのr.in.xyzがある。
同条件で速度比較したところ、なんとスキャンではPythonで書かれた本コードの方がバイナリのr.in.xyzに勝ってしまった。IOを色々工夫したおかげか。
実際のデータ作成で差をつけられるのはメモリアクセスのオーバーヘッドがあるので仕方ない。
| プログラム | 最大最小値スキャン | 格子データ作成(4GB→11MPix) |
|---|---|---|
| xyppy2(これ) | 221 sec. | 761 sec. |
| r.in.xyz (mean) | 380 sec. | 425 sec. |
- 利点1. Pythonなので処理前に一手間加えたりという技が可能(例:同時にUTMへ変換)
- 利点2. Pythonなので不測のインプットデータにも現場で対応しやすい
- 利点3. 点群密度の格子データも生成するので、データ範囲と品質管理しやすい
- 敗北点1. 現状では1種類のアルゴリズムしかサポートしていない
- 敗北点2. 大きな格子データを作る際は所要時間で水を開けられる
準備とサンプルデータ
行列計算にnumpy、地理データの読み込みの為にgdalを使用する。今回は扱わないが、座標系を同時に変換するのであればpyprojを噛ませると良いだろう。
その他にファイルサイズの取得にos、所要時間の計測のためにtimeも用いる。
今回用いたサンプルデータは、NOAAのサイトで公開されている膨大な海底地形データのうち、米海軍が2010年に取得したマリアナ海溝のデータを使う。ここは現世の地球で最も深いチャレンジャー海淵(約-11000 m)がある地域で、ダイナミックな地形が広がっている。
MBSystemでエクスポートした点群データは約4GBあった。
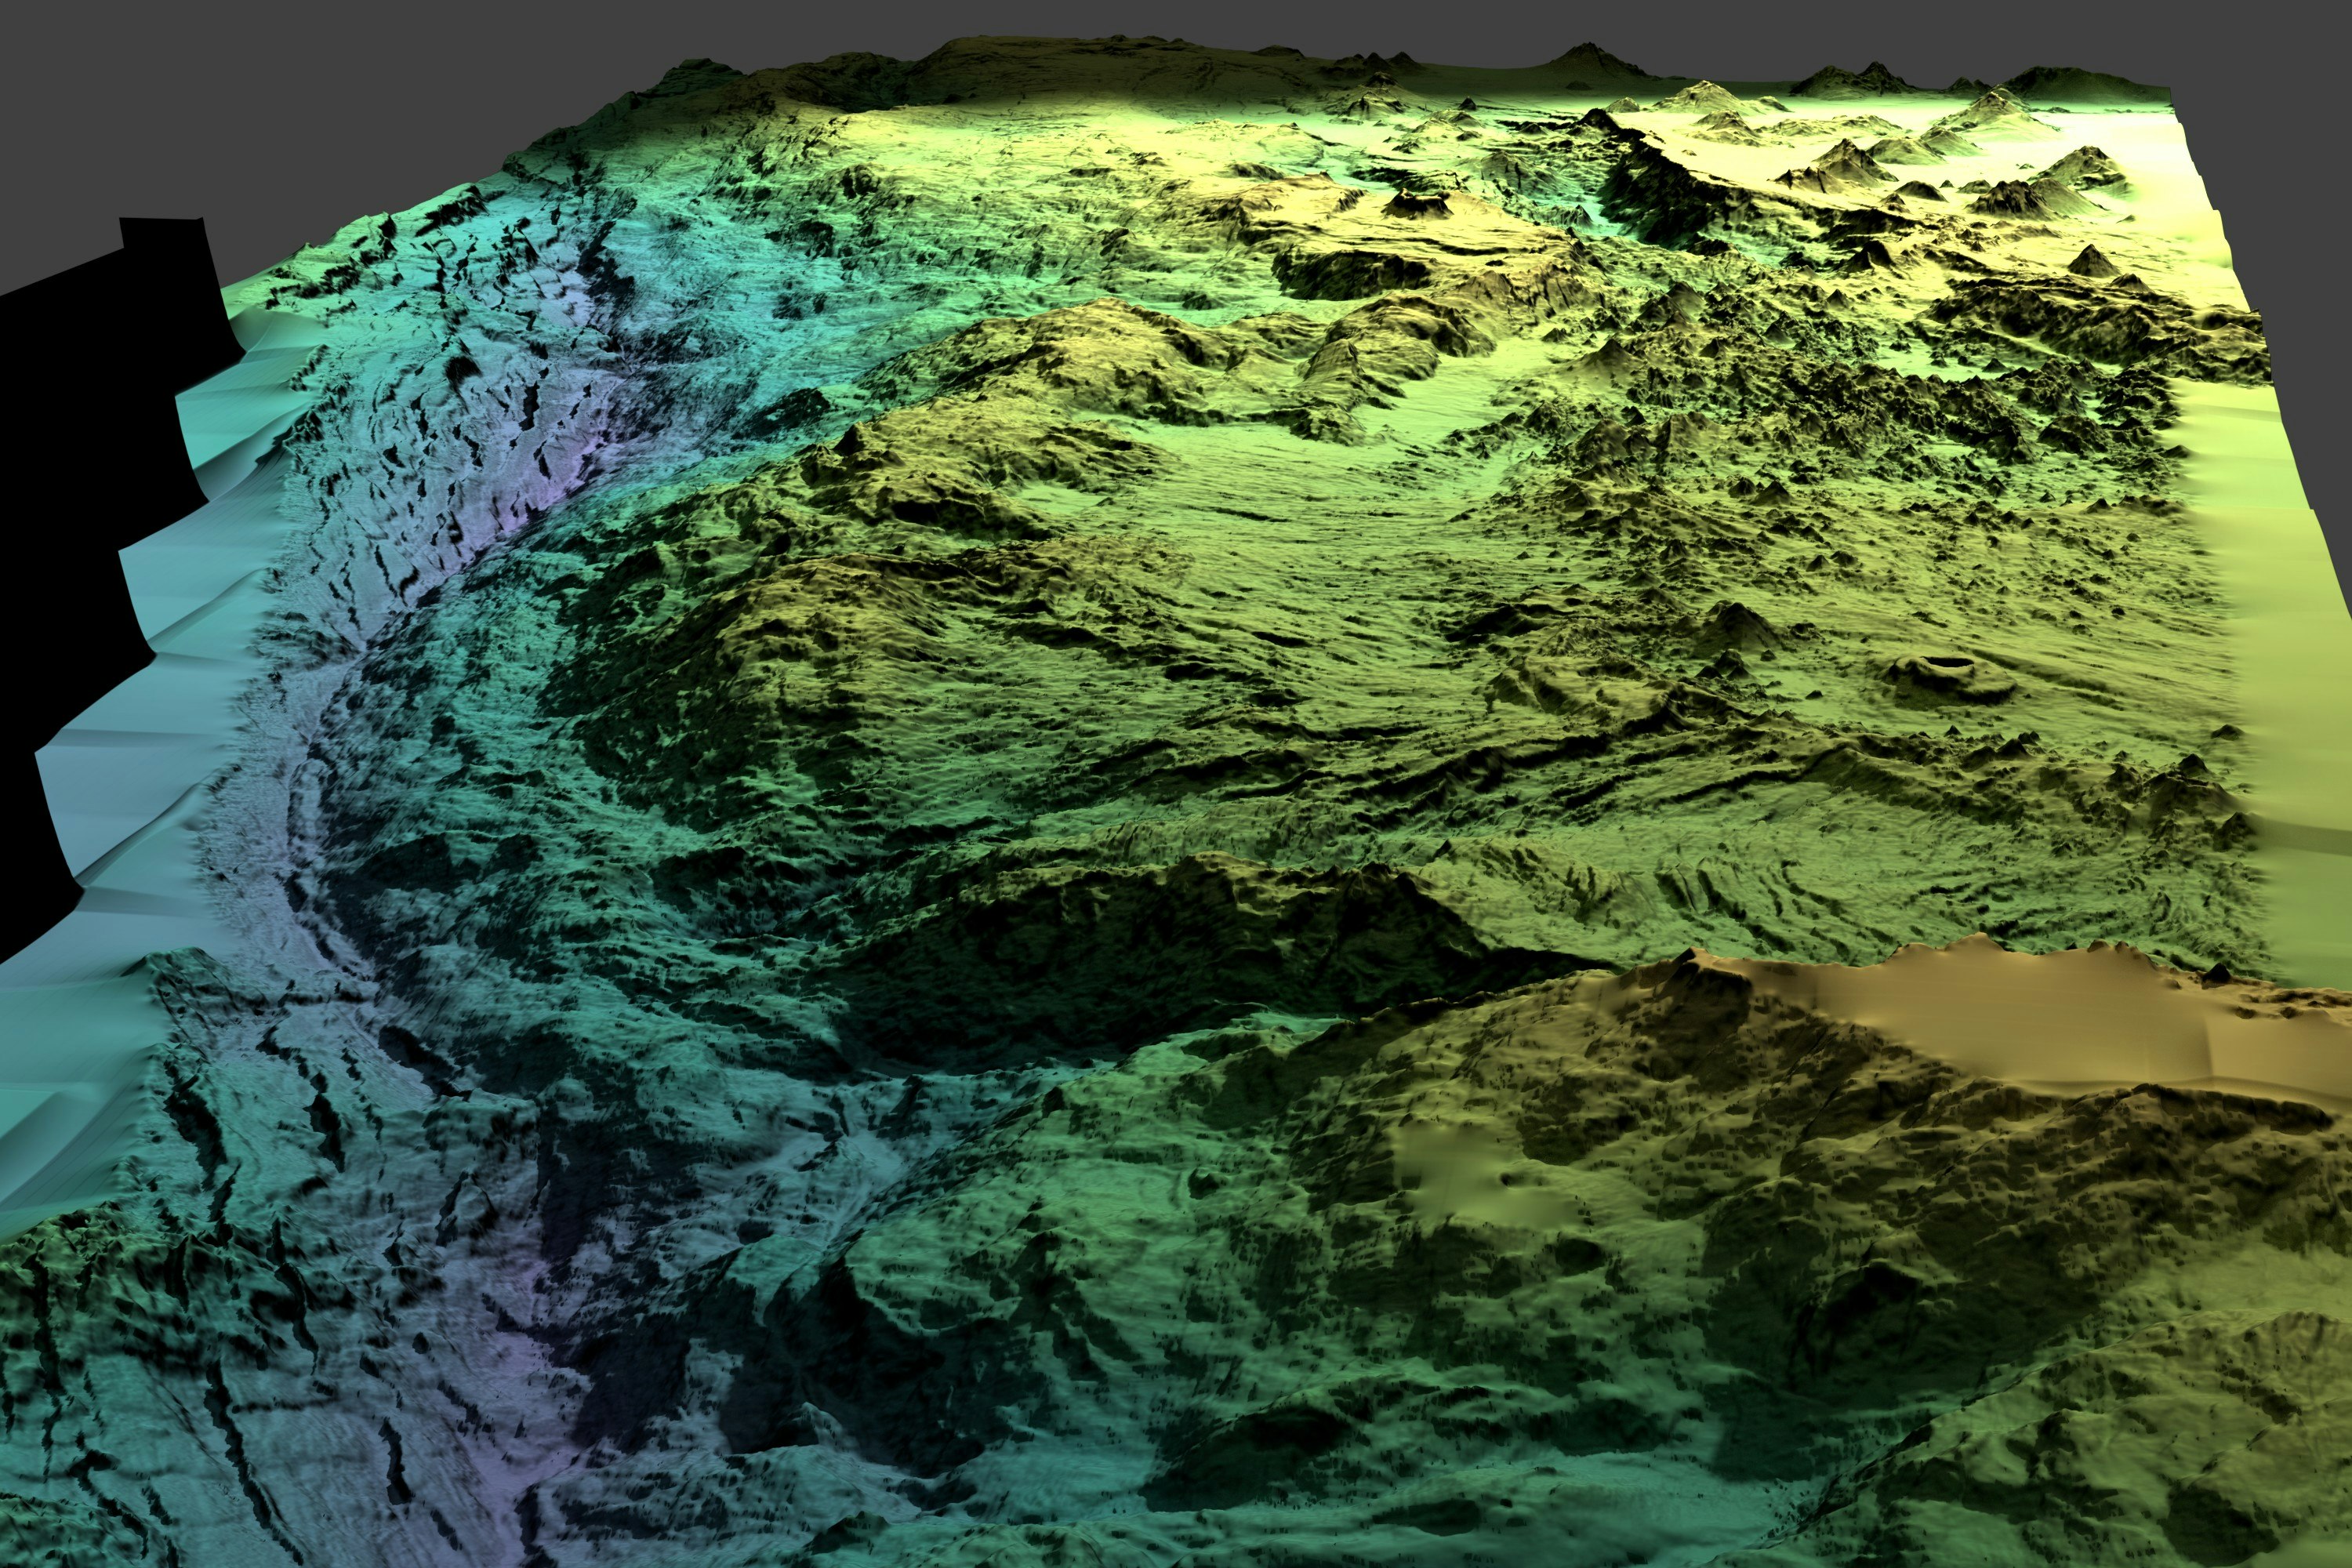
(最終成果物の3Dレンダリング画像)
コード
コードはグリッドデータを扱うclass Gridと点群データを扱うclass PointCloudからなる。前者は単なるgdalモジュールのラッパーだが、後者はpythonのIOをできるだけ高速にするべく趣向が凝らしてある。
中でも一番のキモはPointCloud.__read__()。ファイルIOのラッパーで、その実態は数百行まとめて読み込んだ点群をパースし返してくるジェネレータである。 これによりファイルオブジェクトを気にせず複数のファイルをシームレスに高速に読み込むことができる。
from numpy import *
from time import time
import os, gdal

class Grid:
    def __init__(self, infile=None, newshape=None, newgeotransform=None):
        if infile:
            self.fname, self.ds = infile, gdal.Open(infile)
            self.Z = self.ds.GetRasterBand(1).ReadAsArray()
            self.shape = self.Z.shape
            self.x0, self.dx, self.xy, self.y0, self.yx, self.dy = self.ds.GetGeoTransform()
        else:
            self.Z, self.shape = zeros(newshape,float), newshape
            self.x0, self.dx, self.xy, self.y0, self.yx, self.dy = newgeotransform
    def save(self, newfile):
            self.ds = gdal.GetDriverByName('GTiff').Create(newfile,self.shape[1],self.shape[0], 1, gdal.GDT_Float32)
            self.ds.SetGeoTransform((self.x0, self.dx, self.xy, self.y0, self.yx, self.dy))
            self.ds.GetRasterBand(1).WriteArray(self.Z)
            self.ds = None
    def real2node(self, x,y):
        return (x + self.dx - self.x0)/self.dx, (y + self.dy - self.y0)/self.dy

class PointCloud:
    def __init__(self, infiles, delimiter=',', buffsize=10**6, progress=0.1):
        self.infiles = infiles
        self.delimiter, self.buffsize,self.progress = delimiter, buffsize, progress

        ## Checking actual files
        self.filesize = sum([os.path.getsize(infile) for infile in infiles])
        with open(infiles[0]) as fr:
            Lines = [fr.readline() for i in range(5)]
            self.axis = len(Lines[0].strip().split(delimiter))
            self.extent = [[nan,nan] for ax in range(self.axis)] ##Temp; Filled by self.GetExtent()
            print('First five lines of %d axis:' % self.axis); [print(line, end='') for line in Lines]
            self.AverageBytePerLine = sum([len(line) for line in Lines]) / 5.0
            self.LinesTotalEst = self.filesize / self.AverageBytePerLine
        print('File size total: %.1f MB | Approx. %d lines' % (self.filesize/10**6, self.LinesTotalEst))

    def __read__(self):
        self.timestart, self.processed = time(), 0.0
        for infile in self.infiles:
            fr = open(infile); print('[Open] '+infile, end='')
            milestones = arange(0, 10.0, self.progress)
            while True:
                Lines = fr.readlines(self.buffsize)
                if not len(Lines)>0: break ##EOF
                Items = [line.strip().split(self.delimiter) for line in Lines if len(line)>0] ## str text -> str list
                self.processed += self.buffsize
                ## Print progress ##
                if self.processed/self.filesize > milestones[0]:
                    print(' -> %.1f%%' % (self.processed*100.0/self.filesize), end='')
                    if len(milestones) % 5 == 0: print(' (%.1f sec.)' % (time()-self.timestart))
                    milestones = delete(milestones, 0, axis=0)
                yield array(Items, float) ##str list -> float array
            fr.close()
    def __write__(self, fw, XYZ, delimiter=','):
        [fw.write(line) for line in \
         [delimiter.join(items)+"\n" for items in array(XYZ,str)]]

    def GetExtent(self):
        def manip2(self, ax, Vmin, Vmax):
            self.extent[ax][0] = Vmin[ax] if isnan(self.extent[ax][0]) or (Vmin[ax]<self.extent[ax][0]) else self.extent[ax][0]
            self.extent[ax][1] = Vmax[ax] if isnan(self.extent[ax][1]) or (self.extent[ax][1]<Vmax[ax]) else self.extent[ax][1]
        def manip1(self, XYZ):
            Vmin = [nanmin(XYZ[:,ax]) for ax in range(self.axis)]
            Vmax = [nanmax(XYZ[:,ax]) for ax in range(self.axis)]
            [manip2(self,ax, Vmin,Vmax) for ax in range(self.axis)]
        [manip1(self,xyz) for xyz in [XYZ for XYZ in self.__read__()]]
        print('[Extent]')
        [print(ax,': ',self.extent[ax][0],' ~ ',self.extent[ax][1]) for ax in range(self.axis)]

    def GriddingXYZ(self, newfile, bound, dx,dy, densityfile=None, intensityfile=None):
        x1,x2,y1,y2 = bound
        geotransform = x1, dx, 0, y1, 0, dy
        newshape = int(round((bound[3]-bound[2])/dy)), int(round((bound[1]-bound[0])/dx)) ##Need to be reversed
        print('Grid size: %d x %d | Cell size: %f x %f' % (newshape[1],newshape[0],dx,dy))
        Density = Grid(newshape=newshape, newgeotransform=geotransform)
        Intensity = Grid(newshape=newshape, newgeotransform=geotransform)
        def work1(xyz):
            ix,iy = Density.real2node(xyz[0],xyz[1])
            if not ((0<=ix<newshape[1]-1) and (0<=iy<newshape[0]-1)): return 0
            ix,iy = map(int, [round(ix), round(iy)])
            Density.Z[iy,ix] += 1
            Intensity.Z[iy,ix] += xyz[2]
            return 1
        [[work1(xyz) for xyz in XYZ] for XYZ in self.__read__()]
        if densityfile: Density.save(densityfile)
        if intensityfile: Intensity.save(intensityfile)
        Gridded = Grid(newshape=newshape, newgeotransform=geotransform)
        Gridded.Z = Intensity.Z / Density.Z
        Gridded.save(newfile); print('[Save] > '+newfile)
ワークフロー
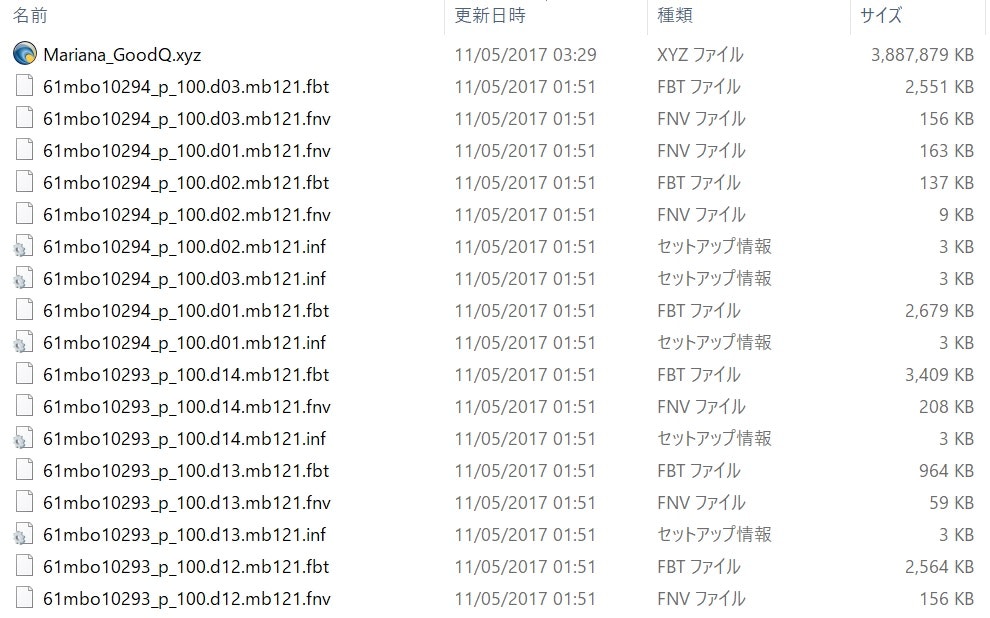
MBsystemで書き出したタブ区切りの4GB近い点群ファイル(Mariana_GoodQ.xyz)がある。これを格子データにする。
139.4626377720	  11.1960077645	1368.2609
139.4626091030	  11.1960210929	1369.1757
139.4625814391	  11.1960337907	1370.5493
139.4625527017	  11.1960468434	1372.3878
139.4625230214	  11.1960608028	1372.8438
....
まずPointCloudクラスを使って点群ファイルの設定を与える。
入力ファイルはリストで、複数を擬似的に一纏めに取り扱うことができるのがポイント。
クラスが作成された時点で数行読み込み、ファイルサイズから行の総数を推定する。
progressでは後に行う処理における進捗表示をカスタマイズできる。0.01では約1%ごと、0.001では約0.1%ごとに進捗がプリントされる。
>>> PC1 = PointCloud(['Mariana_GoodQ.xyz'], delimiter='\t', progress=0.01)
First five lines of 3 axis:
 139.4626377720	  11.1960077645	1368.2609
 139.4626091030	  11.1960210929	1369.1757
 139.4625814391	  11.1960337907	1370.5493
 139.4625527017	  11.1960468434	1372.3878
 139.4625230214	  11.1960608028	1372.8438
File size total: 3981.2 MB | Approx. 94790182 lines
最初に把握すべきなのはデータの範囲なので、GetExtent()メソッドを実行して全ての点群データをスキャンする。
>>> PC1.GetExtent()
[Open] Mariana_GoodQ.xyz -> 0.0% (0.1 sec.)
 -> 1.0% -> 2.0% -> 3.0% -> 4.0% -> 5.0% (10.4 sec.)
 -> 6.0% -> 7.0% -> 8.0% -> 9.0% -> 10.0% (20.5 sec.)
...
 -> 96.0% -> 97.0% -> 98.0% -> 99.0% -> 100.0% (220.5 sec.)
[Extent]
0 :  -0.0657369645  ~  147.472950041
1 :  -0.153173099  ~  17.5932592818
2 :  0.0  ~  10956.0
Processing finished in 221.510 sec.
やっては見たものの最小値がおかしなことになっている(こういうデータにはありがち)。そこで、データ元の調査範囲の情報を用い、取り敢えず粗めの解像度(0.01°)で格子データを作ることにする。
因みに範囲を[x1,x2,y2,y1]としてグリッドサイズのdyに負を与えているのは、ラスタデータの左上を原点にするための慣習。
>>> bound = [138.43, 147.41, 17.51, 10.79]
>>> PC1.GriddingXYZ('average.tif', bound, dx=0.01, dy=-0.01, densityfile='density.tif')
Grid size: 898 x 672 | Cell size: 0.010000 x -0.010000
[Open] Mariana_GoodQ.xyz -> 0.0% (0.0 sec.)
 -> 1.0% -> 2.0% -> 3.0% -> 4.0% -> 5.0% (37.8 sec.)
...
 -> 96.0% -> 97.0% -> 98.0% -> 99.0% -> 100.0% (876.9 sec.)
[Save] > average.tif
Processing finished in 877.304 sec.
実はNumpyのゼロ除算のWarnが出るが(当然)、無視して構わない。
Average.tifは無視して出力されたDensity.tifをQGISで表示させてみる。粗いが全世界をカバーしているGEBCO 2014 Gridをベースマップとして重ねると、以下のようにデータが実際にある範囲が浮かび上がる。
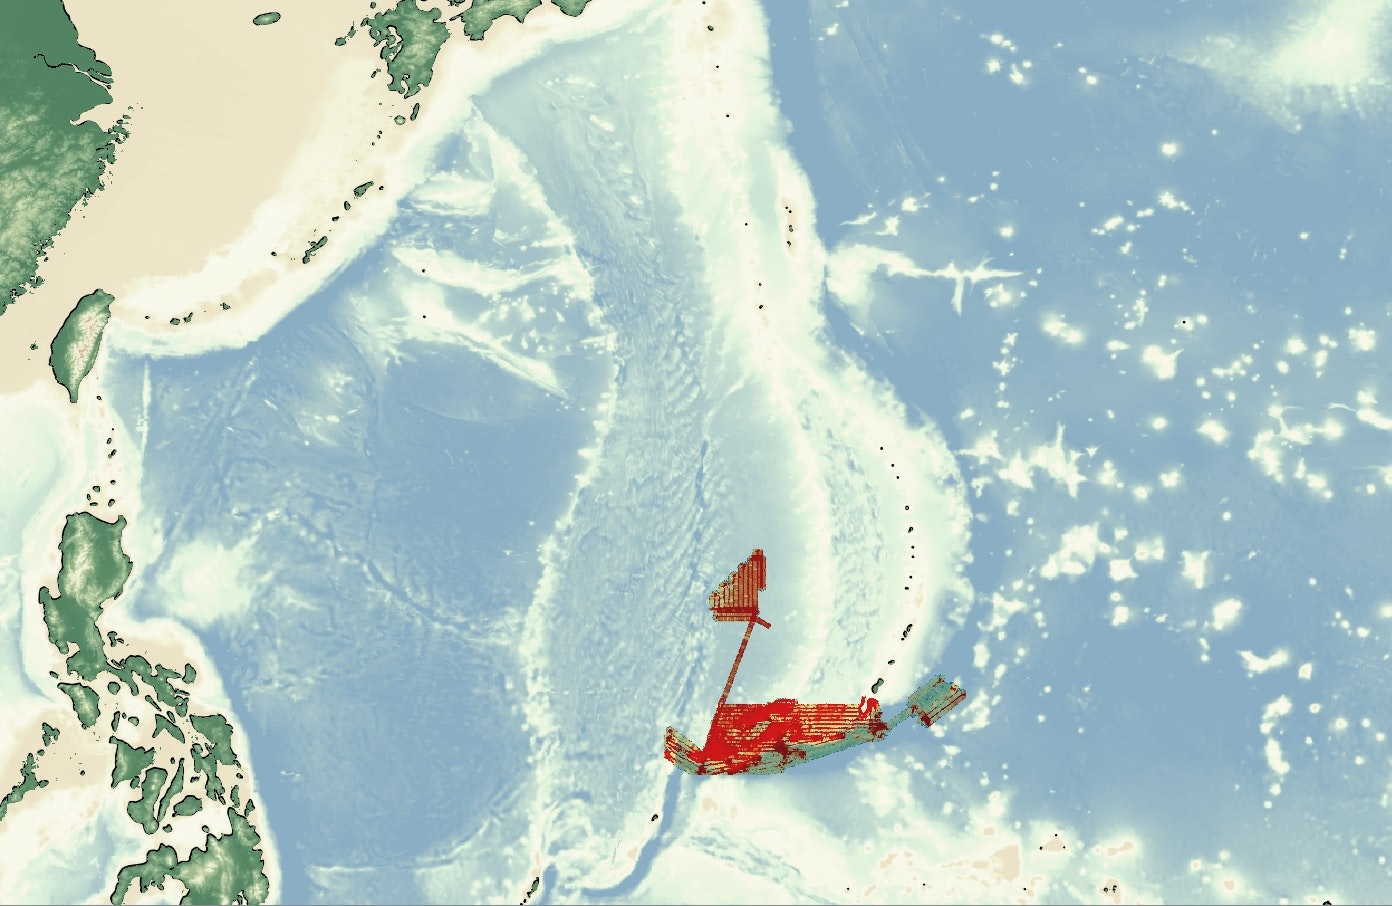
ここから最終製品を造る際に必要な2つの知見を得ることができる。
- 厳密なデータの存在する範囲
- 最適な解像度
→ 最も点群密度が低い海溝部で緑色(125点/セル)なので、セルの幅を更に1/10にしても殆どのエリアで1点以上残ることがわかる。
今回欲しいのは海溝のデータなので、座標の範囲をGISで確認した後、dxとdyを0.01→0.001にして再度処理を実行する。
>>> bound = [140,145,13,10.8]
>>> PC1.GriddingXYZ('average.tif', bound, dx=0.001, dy=-0.001, densityfile='density.tif')
Grid size: 5000 x 2200 | Cell size: 0.001000 x -0.001000
[Open] Mariana_GoodQ.xyz -> 0.0% (0.0 sec.)
 -> 1.0% -> 2.0% -> 3.0% -> 4.0% -> 5.0% (18.4 sec.)
....
 -> 96.0% -> 97.0% -> 98.0% -> 99.0% -> 100.0% (760.2 sec.)
[Save] > average.tif
Processing finished in 761.388 sec.
USB3.0+UASPの外付けSSDにある4GB近い点群データだったが、11メガピクセルのグリッドを生成するのに13分程度であった。十分現実的な時間だと思う。
QGISにプロットするとこんな感じ。
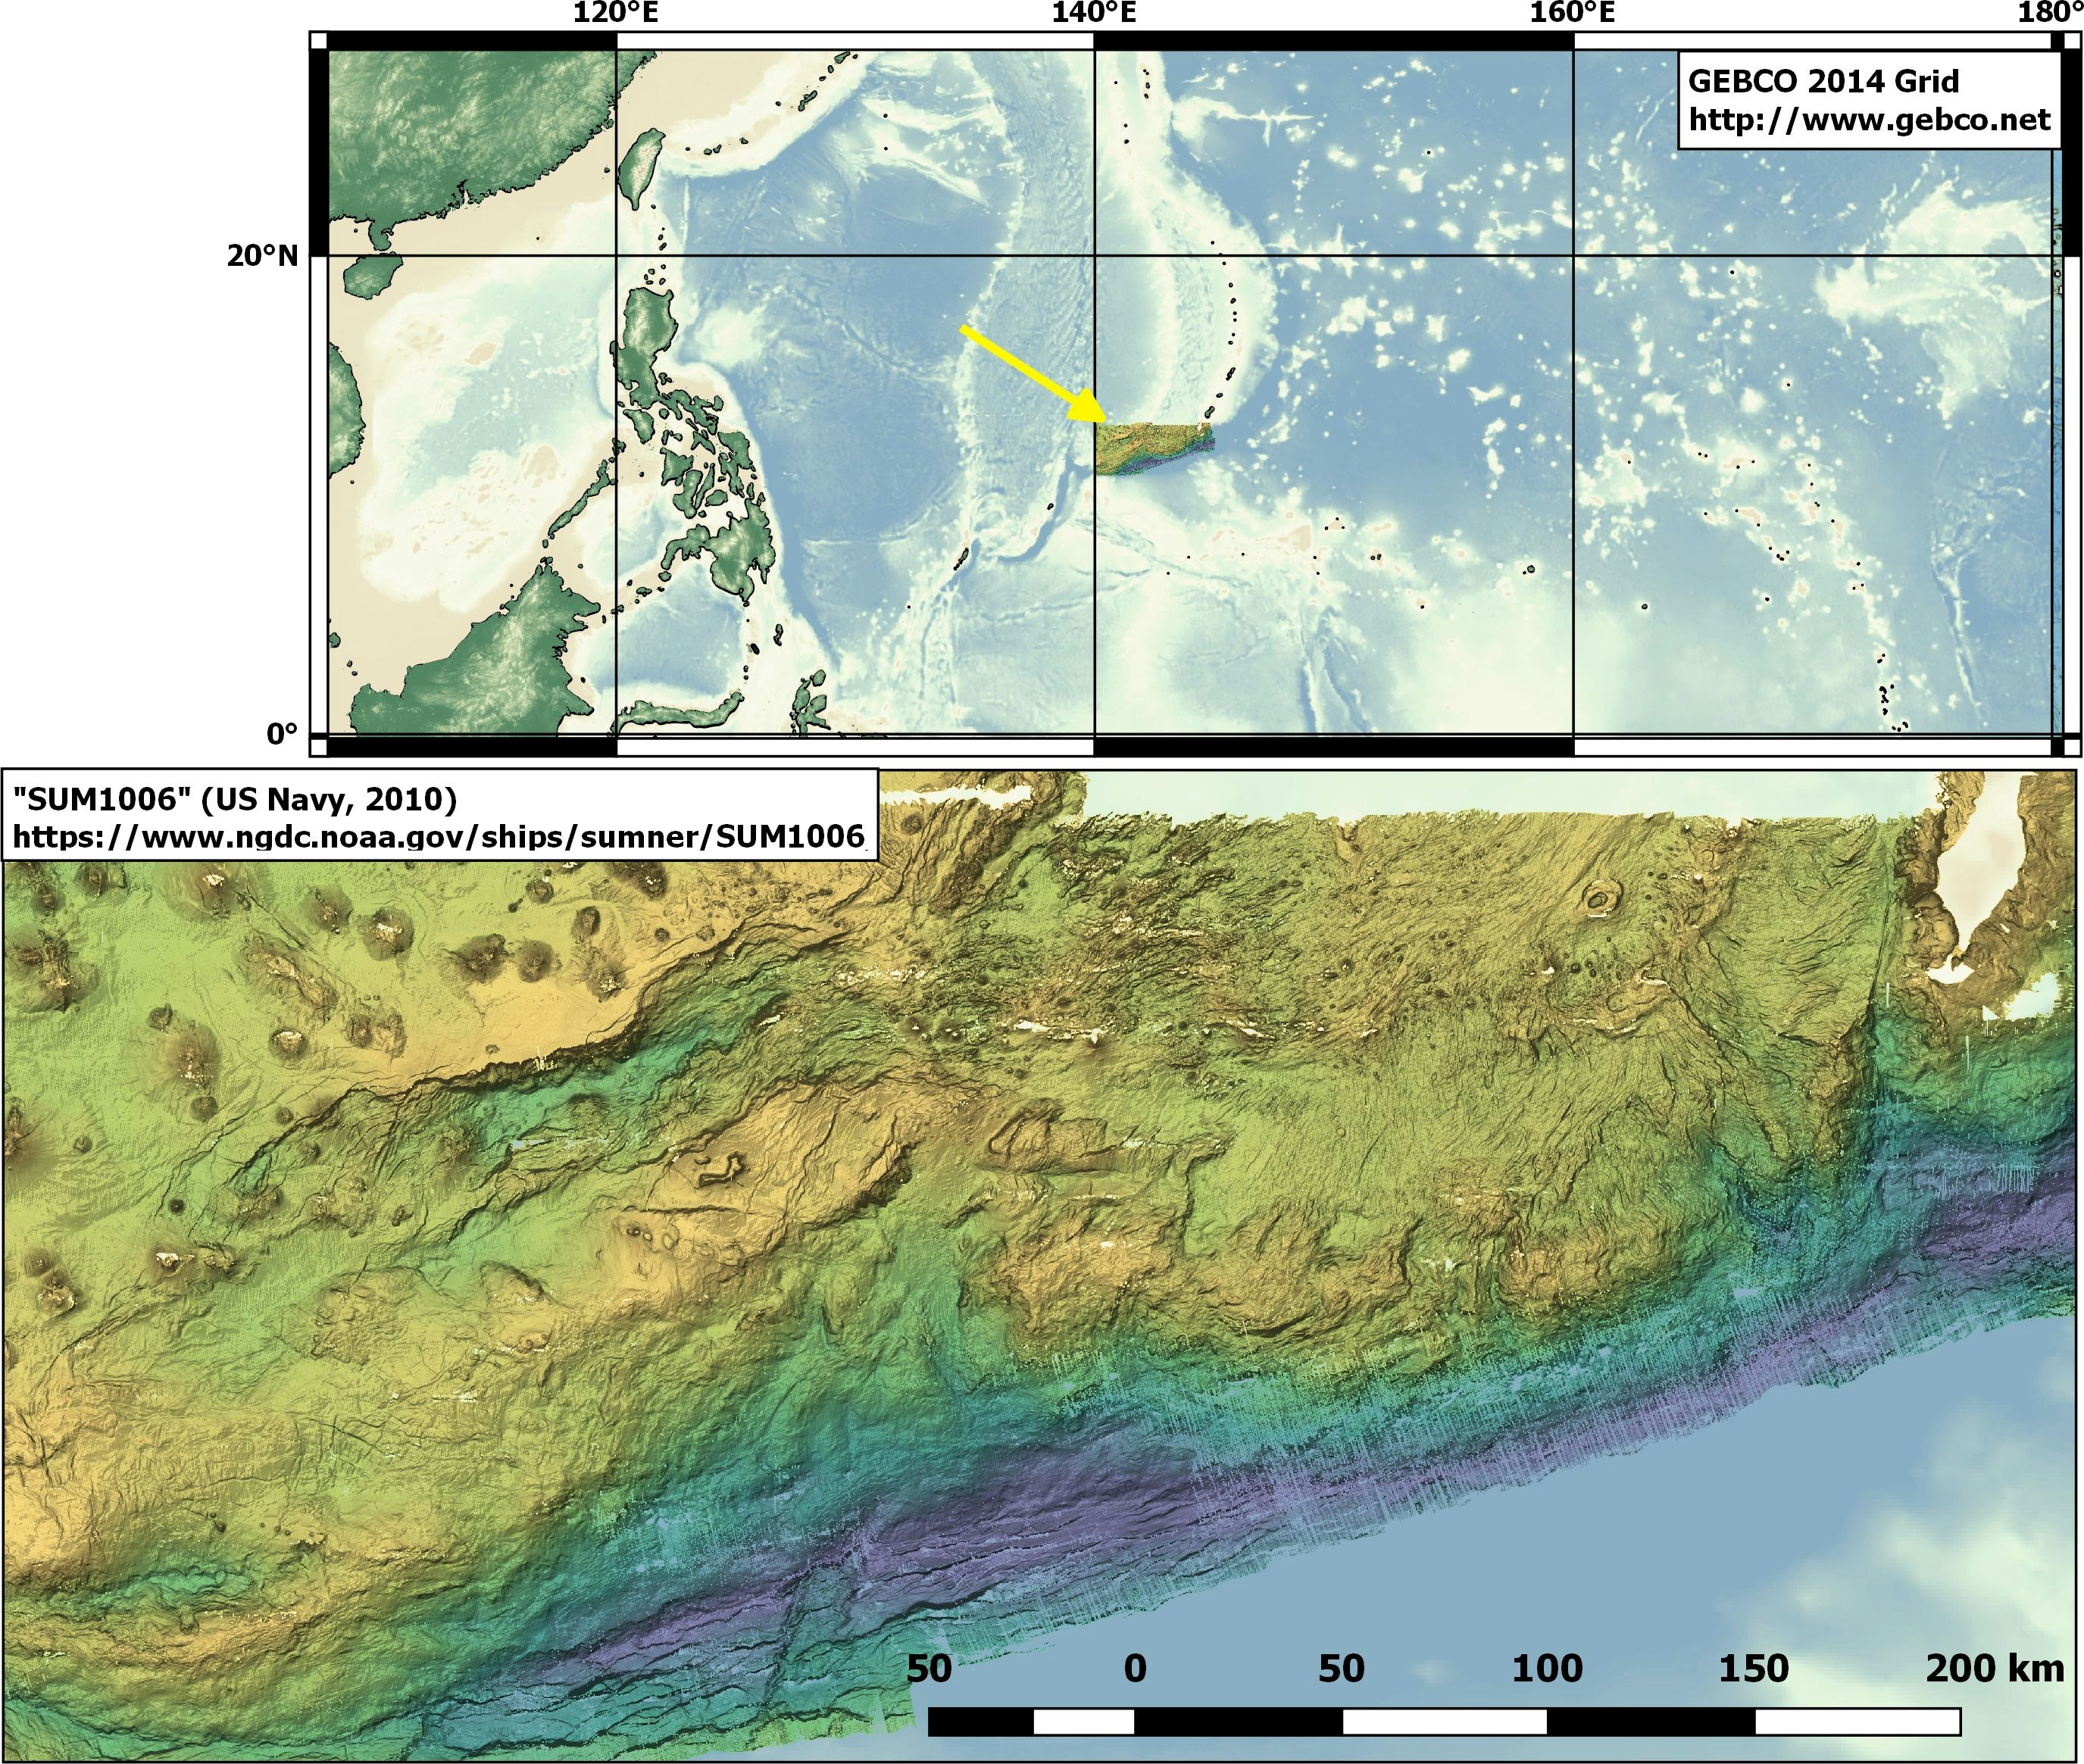
浅い部分は良いが、海溝の中は欠損値が目立ってしまったのでグリッド間隔は0.002の方が美しかったかもしれない。ただ小さい穴ばかりなので、QGISのToolboxからもGUIでアクセスできるGrassのr.fillnullsで埋めて綺麗にすることができる。