Jupyter notebookとは?
一言で言うと、ブラウザで動く超便利なREPLです。
もともとJupyter notebookはPython用のプロジェクトだったのですが12、近頃はRubyも使えるようになっています。
本記事では、Jupyter notebook上でRubyを使い、グラフを書く方法を解説します。
環境構築
下記はMacを想定しています。
まずJupyterを導入して、次にIRubyを導入します。
それ以外の環境の方はこちら:
- Bash on Windows (Creators Update以降)
- Ubuntu Linux 16.04
- [Docker](Dockerが使える環境であれば https://github.com/sciruby-jp/iruby-notebook#docker-での試用方法)
Jupyterの導入
pip を使う方法と Anaconda を使う方法があります。ここでは pip を使います。
$ brew install python3
$ sudo -H pip3 install jupyter
$ jupyter notebook
これでJupyterが立ち上がり、ブラウザでhttp://localhost:8888が開きます。
IRubyの導入
このままだとPythonしか使えないので、Jupyter上でRubyが使えるようにします。
一旦ターミナルでCtrl-cしてjupyterを終了してください。
IRuby kernelをインストールし、設定します:
$ brew install zeromq --HEAD
$ brew install czmq --HEAD
$ gem install cztop iruby
$ iruby register --force
$ jupyter notebook
これで、先程と同様にhttp://localhost:8888がブラウザで開きます。
New ▼からRubyが選べるようになりました ![]()
グラフを書く
さっそくJupyterを使ってみましょう。
以下の内容はnbviewerに上げてるので、そちらも参考にしてください。
rbplotly
rbplotlyというgemを導入します。Jupyter上でグラフを書くgemです。
$ gem install rbplotly
New ▼ からRubyのNotebookを開いて以下の内容をセルに入力し、実行(Shift+Enter or Command+Enter)します。
require 'rbplotly'

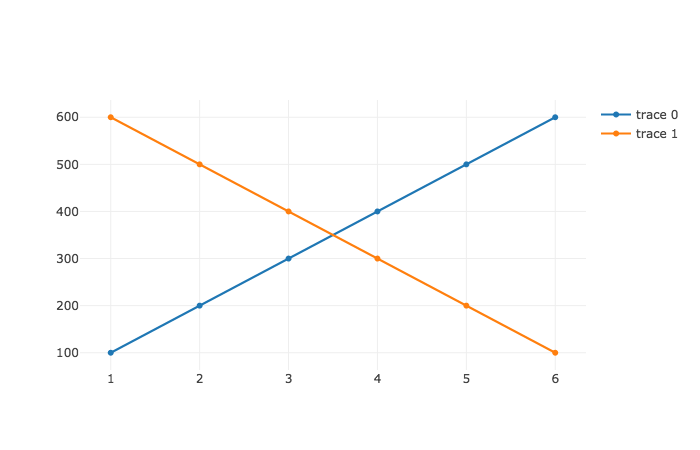
trace1 = { x: [1,2,3,4,5,6], y: [100,200,300,400,500,600] }
trace2 = { x: [1,2,3,4,5,6], y: [600,500,400,300,200,100] }
traces = [trace1, trace2]
pl = Plotly::Plot.new(data: traces)
pl.show
これで、グラフが表示されます。3
これはただの折れ線グラフですが、棒グラフや円グラフ、ヒストグラム、ヒートマップなども書けます。4
daru + daru-plotly
次に、csvからデータを読み込み、それをグラフにしてみましょう。
gemの導入
daruとdaru-plotlyを導入します。
$ gem install daru daru-plotly
そして、notebook上部のKernel > Restart & Run Allを実行しましょう。これで、新しくインストールしたgemがnotebookで使えるようになります。
csvを読み込む
ここでは、例として会津若松市の年齢別人口のcsvを使います。
notebookに新しくセルを作成し、以下のように入力&実行します。
新しいセルを作成するには、一度Escでセルからフォーカスを外した後bを入力すれば良いです。
require 'daru'

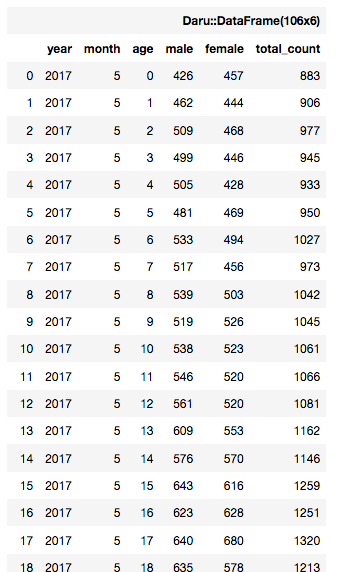
df = Daru::DataFrame.from_csv('./O_TUKIBETSU_NENREI.csv')
このように、csvファイルの内容が表示されたと思います。
グラフを描く
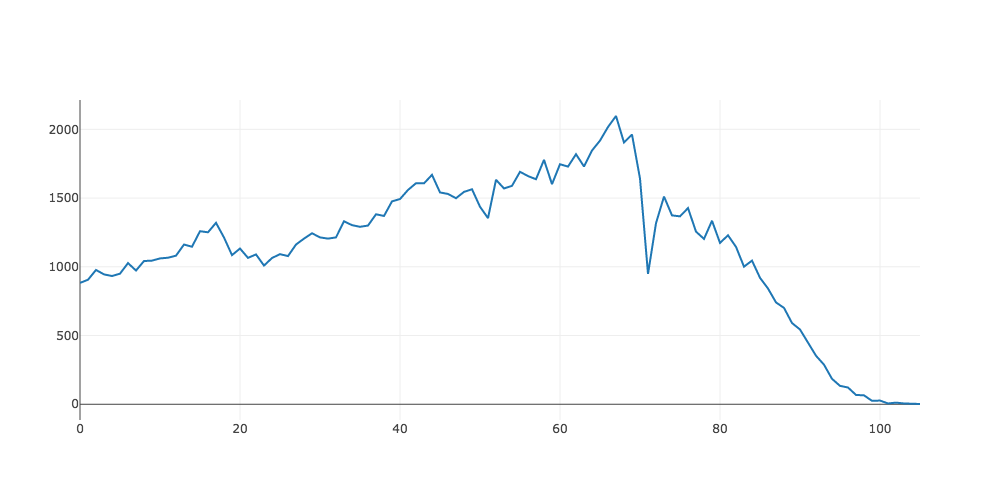
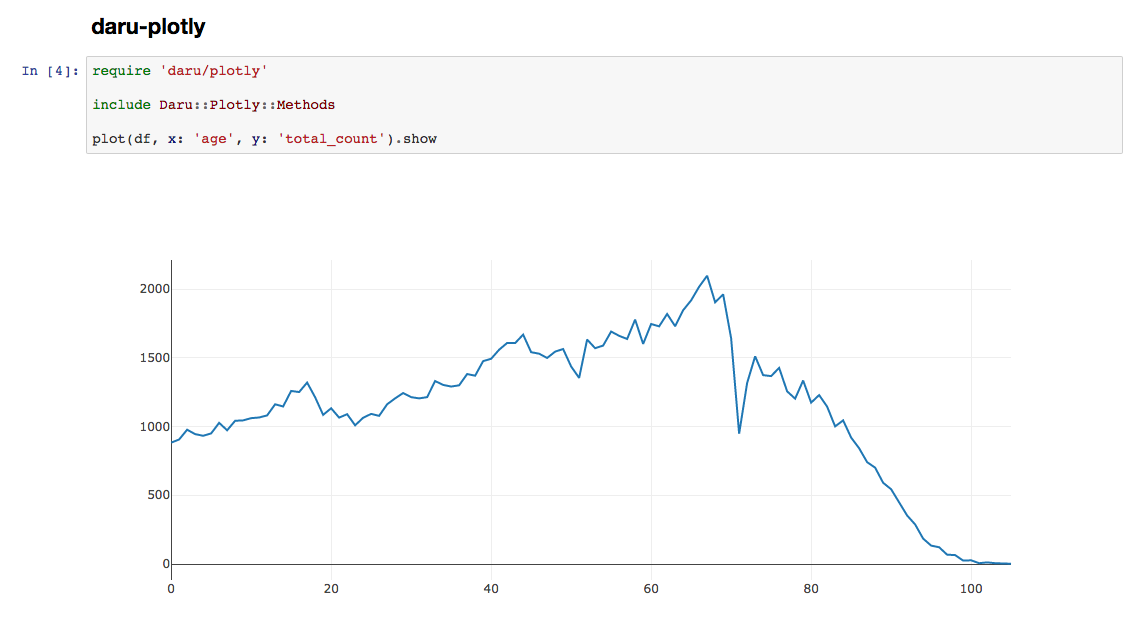
このデータフレームから、横軸がage、縦軸がtotal_countのグラフを作成しましょう。
新しいセルを作成し、以下のように入力して実行します:
require 'daru/plotly'
include Daru::Plotly::Methods # plotメソッドが使えるようになる

plot(df, x: 'age', y: 'total_count').show
このように、xとyにdfの列名を指定することで、それらをグラフに起こすことができます。
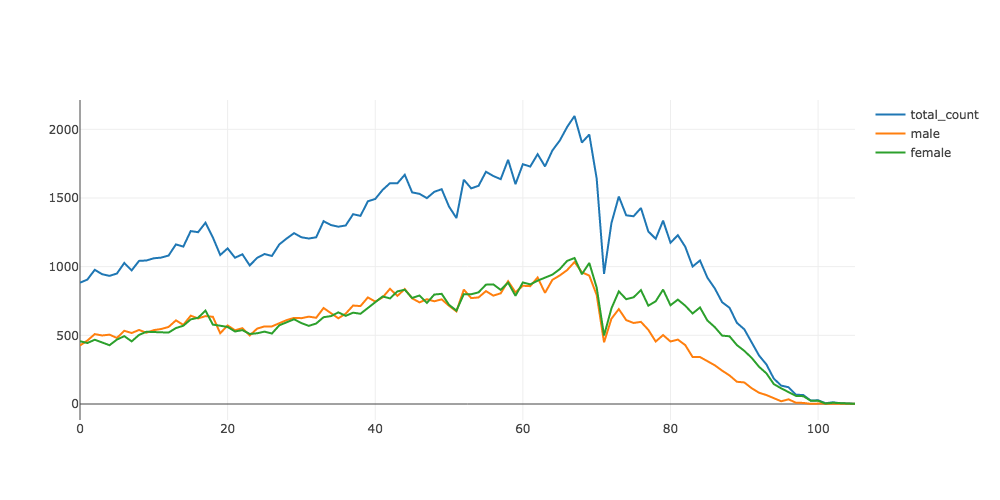
次に、男女別の人口を見てみましょう。新しいセルを作って、以下のように入力して実行します:
plot(df, x: 'age', y: ['total_count', 'male', 'female']).show
このように、yには列名のArrayを指定することもできます。
notebookを公開する
作成したnotebookは簡単に公開できます。
githubやgistで公開する
githubはJupyter notebookに対応しています。
レポジトリを作ってpushすることもできますが、多くの場合はgistで事足りると思います。
notebookは Ctrl+s で保存することができます。保存したnotebookをgistにアップロードすれば、ブラウザ上で閲覧することができます。
$ gem install gist
$ gist hoge.ipynb
https://gist.github.com/84cd6fe6a1bb57cc88a0fb3b3a88fb3b
ただし、githubやgistで公開されているnotebookを閲覧する場合、JavaScriptが実行されないためグラフが全く表示されません ![]()
そのため、後述のnbviewerを利用します。
nbviewer
nbviewerというのは、インターネット上で公開されてるnotebookをいい感じに表示してくれるやつです。
ここにnotebookのgistのURLを入力すると、ちゃんとグラフを表示してくれます ![]()
githubからnbviewerにジャンプしてくれるchrome拡張もあり、これと組み合わせて使うと便利です。
Futher more
- daruの使い方:SciRuby/daru
- rbplotlyの使い方:ash1day/rbplotly
- daru-plotlyの使い方:genya0407/daru-plotly
参考
-
正確には、Jupyter notebookの前身であるIPython notebookがPython用のプロジェクトだった。 ↩
-
Jupyter notebook自身は様々な言語で使うことができる。HaskellのKernelとかもある ↩
-
JavaScript Errorみたいなのが出た人は、notebook上部からKernel > Restart & Run Allを選択して実行してください。 ↩ -
ash1day/rbplotlyに例があります。 ↩
