StatsModelsを使って、Boston Housingデータセットを重回帰解析します。
scikit-learnを用いた重回帰解析の例はよく見られますが、ここでは、StatsModelsを用いて重回帰解析を行います。
StatsModelsを使うと、解析の結果得られた重回帰式の精度を表す各指標を表示することが可能です。
$$y = w_0x_0 + w_1x_1 + ... + w_mx_m = \sum_{i=0}^{m}w_ix_i=w^Tx$$
データの準備
Housingデータセットの特徴量
- CRIM:犯罪発生率
- ZN:25,000兵法フィールド以上の住宅区画の割合
- INDUS:非小売業の土地面積の割合(人口単位)
- CHRS:チャールズ川沿いかどうか
- NOX:窒素酸化物の濃度(pphm単位)
- AGE:1940年よりも前に建てられた家屋の割合
- DIS:ボストンの主な5つの雇用圏までの重み付きの距離
- RAD:幹線道路へのアクセス指数
- TAX:10,000ドル当たりの所得税率
- PTRATIO:教師当たりの生徒数(人工単位)
- B:$1000(Bk-0.63)^2$として計算、$Bk$はアフリカ系アメリカ人居住者の割合(人口単位)
- LSTAT:低所得者の割合
- MDEV:住宅価格の中央値(単位1,000ドル)
データのダウンロード
import pandas as pd

df = pd.read_csv('https://archive.ics.uci.edu/ml/machine-learning-databases/housing/housing.data',
                 header=None, sep='\s+')
df.columns = ['CRIM', 'ZN', 'INDUS', 'CHAS', 'NOX', 'RM', 'AGE', 'DIS', 'RAD',
              'TAX', 'PTRATIO', 'B', 'LSTAT', 'MEDV']
df.head()
| CRIM | ZN | INDUS | CHAS | NOX | RM | AGE | DIS | RAD | TAX | PTRATIO | B | LSTAT | MEDV | |
|---|---|---|---|---|---|---|---|---|---|---|---|---|---|---|
| 0 | 0.00632 | 18.0 | 2.31 | 0 | 0.538 | 6.575 | 65.2 | 4.0900 | 1 | 296.0 | 15.3 | 396.90 | 4.98 | 24.0 |
| 1 | 0.02731 | 0.0 | 7.07 | 0 | 0.469 | 6.421 | 78.9 | 4.9671 | 2 | 242.0 | 17.8 | 396.90 | 9.14 | 21.6 |
| 2 | 0.02729 | 0.0 | 7.07 | 0 | 0.469 | 7.185 | 61.1 | 4.9671 | 2 | 242.0 | 17.8 | 392.83 | 4.03 | 34.7 |
| 3 | 0.03237 | 0.0 | 2.18 | 0 | 0.458 | 6.998 | 45.8 | 6.0622 | 3 | 222.0 | 18.7 | 394.63 | 2.94 | 33.4 |
| 4 | 0.06905 | 0.0 | 2.18 | 0 | 0.458 | 7.147 | 54.2 | 6.0622 | 3 | 222.0 | 18.7 | 396.90 | 5.33 | 36.2 |
データセットの可視化
散布図行列
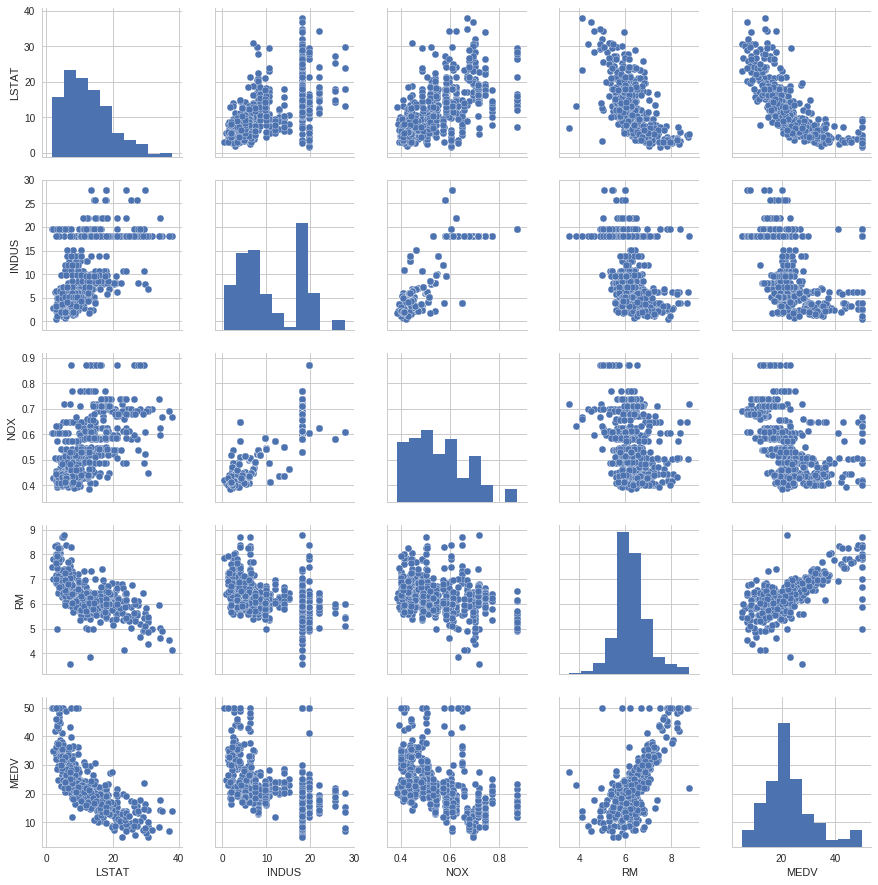
全変数を対象とすると、図が小さくなってしまうので、ここでは、LSTAT、INOUS、NOX、RMとMEDVを対象に散布図行列を作っています。
%matplotlib inline
import matplotlib.pyplot as plt
import seaborn as sns

sns.set(style='whitegrid', context='notebook')
cols = ['LSTAT', 'INDUS', 'NOX', 'RM', 'MEDV']
sns.pairplot(df[cols], size=2.5)
plt.show()
相関行列のヒートマップ
import numpy as np

cm = np.corrcoef(df[cols].values.T)
sns.set(font_scale=1.5)
hm = sns.heatmap(cm,
                 cbar=True,
                 annot=True,
                 square=True,
                 fmt='.2f',
                 annot_kws={'size': 15},
                 yticklabels=cols,
                 xticklabels=cols)
plt.show()
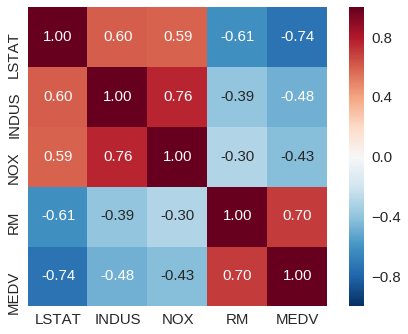
相関係数が1に近づくほど、正の相関が高く、-1に近づくほど、負の相関が高くなるとされています。0は、無相関を表します。
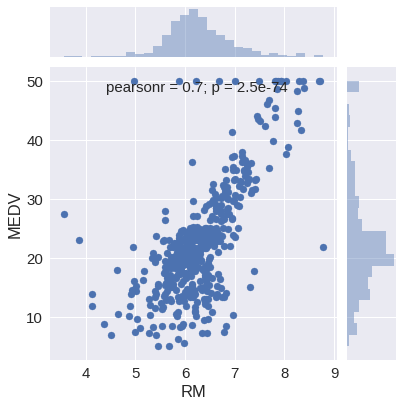
部屋数と価格の散布図とヒストグラム
sns.jointplot('RM', 'MEDV', data=df)
plt.show()
重回帰解析
import statsmodels.api as sm

X = df.drop('MEDV', 1)
X = sm.add_constant(X)
Y = df['MEDV']
model = sm.OLS(Y, X)
result = model.fit()
result.summary()
| OLS Regression Results | |||
|---|---|---|---|
| Dep. Variable: | MEDV | R-squared: | 0.741 |
| Model: | OLS | Adj. R-squared: | 0.734 |
| Method: | Least Squares | F-statistic: | 108.1 |
| Date: | Mon, 13 Aug 2018 | Prob (F-statistic): | 6.72e-135 |
| Time: | 08:41:48 | Log-Likelihood: | -1498.8 |
| No. Observations: | 506 | AIC: | 3026. |
| Df Residuals: | 492 | BIC: | 3085. |
| Df Model: | 13 | ||
| Covariance Type: | nonrobust |
| coef | std err | t | P>t | [0.025 | 0.975] | |
|---|---|---|---|---|---|---|
| const | 36.4595 | 5.103 | 7.144 | 0.000 | 26.432 | 46.487 |
| CRIM | -0.1080 | 0.033 | -3.287 | 0.001 | -0.173 | -0.043 |
| ZN | 0.0464 | 0.014 | 3.382 | 0.001 | 0.019 | 0.073 |
| INDUS | 0.0206 | 0.061 | 0.334 | 0.738 | -0.100 | 0.141 |
| CHAS | 2.6867 | 0.862 | 3.118 | 0.002 | 0.994 | 4.380 |
| NOX | -17.7666 | 3.820 | -4.651 | 0.000 | -25.272 | -10.262 |
| RM | 3.8099 | 0.418 | 9.116 | 0.000 | 2.989 | 4.631 |
| AGE | 0.0007 | 0.013 | 0.052 | 0.958 | -0.025 | 0.027 |
| DIS | -1.4756 | 0.199 | -7.398 | 0.000 | -1.867 | -1.084 |
| RAD | 0.3060 | 0.066 | 4.613 | 0.000 | 0.176 | 0.436 |
| TAX | -0.0123 | 0.004 | -3.280 | 0.001 | -0.020 | -0.005 |
| PTRATIO | -0.9527 | 0.131 | -7.283 | 0.000 | -1.210 | -0.696 |
| B | 0.0093 | 0.003 | 3.467 | 0.001 | 0.004 | 0.015 |
| LSTAT | -0.5248 | 0.051 | -10.347 | 0.000 | -0.624 | -0.425 |
| Omnibus: | 178.041 | Durbin-Watson: | 1.078 |
| Prob(Omnibus): | 0.000 | Jarque-Bera (JB): | 783.126 |
| Skew: | 1.521 | Prob(JB): | 8.84e-171 |
| Kurtosis: | 8.281 | Cond. No. | 1.51e+04 |
scikit-learnだと、解析結果のサマリーが取得できないようです。
- 決定係数(R-squared):0.741
- 自由度調整済み決定係数(Adj. R-squared):0.734
- 有意F(Prob (F-statistic)):6.72e-135
- 各係数のP値:-0.1080, 0.0464, 0.0206, -17.7666, ...
StatsModelsの場合、以下のように個々の指標を取得することもできます。
print('重決定R2:{:.4f}, 補正R2:{:.4f}, 有意F:{:.4f}, 切片:{:.4f}, 係数1:{:.4f}, P値1:{:.4f}, 係数2:{:.4f}, P値2:{:.4f}, ...'.format(
    result.rsquared, result.rsquared_adj, result.f_pvalue,
    result.params[0], result.params[1], result.pvalues[1], result.params[2], result.pvalues[2]))
重決定R2:0.7406, 補正R2:0.7338, 有意F:0.0000, 切片:36.4595, 係数1:-0.1080, P値1:0.0011, 係数2:0.0464, P値2:0.0008, ...
Excelでの検証
!pip install -U -q PyDrive

from pydrive.auth import GoogleAuth
from pydrive.drive import GoogleDrive
from google.colab import auth
from oauth2client.client import GoogleCredentials

auth.authenticate_user()
gauth = GoogleAuth()
gauth.credentials = GoogleCredentials.get_application_default()
drive = GoogleDrive(gauth)

df.to_excel('housing.xlsx')

upload_file_2 = drive.CreateFile()
upload_file_2.SetContentFile('housing.xlsx')
upload_file_2.Upload()
Excelでの解析結果
StatsModelsで得られた数値がExcelで得られた数値と一致しています。
| 回帰統計 | |
|---|---|
| 重相関 R | 0.860605987 |
| 重決定 R2 | 0.740642664 |
| 補正 R2 | 0.733789726 |
| 標準誤差 | 4.745298182 |
| 観測数 | 506 |
| 分散分析表 | |||||
|---|---|---|---|---|---|
| 自由度 | 変動 | 分散 | 観測された分散比 | 有意 F | |
| 回帰 | 13 | 31637.51084 | 2433.65468 | 108.0766662 | 6.72E-135 |
| 残差 | 492 | 11078.78458 | 22.51785483 | ||
| 合計 | 505 | 42716.29542 |
| 係数 | 標準誤差 | t | P-値 | 下限 95% | 上限 95% | 下限 95.0% | 上限 95.0% | |
|---|---|---|---|---|---|---|---|---|
| 切片 | 36.45948839 | 5.103458811 | 7.144074193 | 3.28E-12 | 26.43222601 | 46.48675076 | 26.43222601 | 46.48675076 |
| CRIM | -0.108011358 | 0.032864994 | -3.286516871 | 0.00108681 | -0.172584412 | -0.043438304 | -0.172584412 | -0.043438304 |
| ZN | 0.046420458 | 0.013727462 | 3.381576282 | 0.00077811 | 0.019448778 | 0.073392139 | 0.019448778 | 0.073392139 |
| INDUS | 0.020558626 | 0.061495689 | 0.334310042 | 0.738288071 | -0.100267941 | 0.141385193 | -0.100267941 | 0.141385193 |
| CHAS | 2.686733819 | 0.861579756 | 3.118380858 | 0.00192503 | 0.993904193 | 4.379563446 | 0.993904193 | 4.379563446 |
| NOX | -17.76661123 | 3.819743707 | -4.651257411 | 4.25E-06 | -25.27163356 | -10.26158889 | -25.27163356 | -10.26158889 |
| RM | 3.809865207 | 0.417925254 | 9.1161402 | 1.98E-18 | 2.988726773 | 4.63100364 | 2.988726773 | 4.63100364 |
| AGE | 0.000692225 | 0.013209782 | 0.052402427 | 0.958229309 | -0.02526232 | 0.026646769 | -0.02526232 | 0.026646769 |
| DIS | -1.475566846 | 0.199454735 | -7.398003603 | 6.01E-13 | -1.867454981 | -1.08367871 | -1.867454981 | -1.08367871 |
| RAD | 0.306049479 | 0.06634644 | 4.612899768 | 5.07E-06 | 0.175692169 | 0.436406789 | 0.175692169 | 0.436406789 |
| TAX | -0.012334594 | 0.003760536 | -3.28000914 | 0.001111637 | -0.019723286 | -0.004945902 | -0.019723286 | -0.004945902 |
| PTRATIO | -0.952747232 | 0.130826756 | -7.282510564 | 1.31E-12 | -1.209795296 | -0.695699168 | -1.209795296 | -0.695699168 |
| B | 0.009311683 | 0.002685965 | 3.466792558 | 0.000572859 | 0.004034306 | 0.01458906 | 0.004034306 | 0.01458906 |
| LSTAT | -0.524758378 | 0.050715278 | -10.3471458 | 7.78E-23 | -0.624403622 | -0.425113133 | -0.624403622 | -0.425113133 |


