備忘録を兼ねて、ChainerでNN、CNN、RNNのモデルを作成し、MNISTのディープラーニングのスクリプトを作成します。
事前準備
Google ColaboratoryへのChainerの導入
GPUを使用できるよう、下記のコマンドで必要なモジュールをインストールします。
!apt-get install -y -qq libcusparse8.0 libnvrtc8.0 libnvtoolsext1
!ln -snf /usr/lib/x86_64-linux-gnu/libnvrtc-builtins.so.8.0 /usr/lib/x86_64-linux-gnu/libnvrtc-builtins.so
!pip install cupy-cuda80==4.0.0b4
!pip install chainer==4.0.0b4
必要なモジュールの読み込み
import numpy as np
import chainer
from chainer import cuda, Function, gradient_check, report, training, utils, Variable
from chainer import datasets, iterators, optimizers, serializers
from chainer import Link, Chain, ChainList
import chainer.functions as F
import chainer.links as L
from chainer.datasets import tuple_dataset
from chainer import training
from chainer.training import extensions
MNISTの読み込み
train, test = datasets.get_mnist(ndim=3)
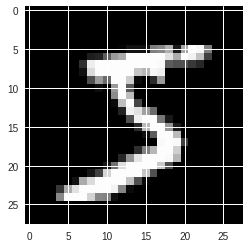
データを確認します。
%matplotlib inline
import matplotlib.pyplot as plt

plt.imshow(np.array(train[0][0][0], dtype=np.float32), cmap='gray')
print('この画像データのラベルは{:0d}です。'.format(train[0][1]))
ニューラルネットワークでの学習
モデルの定義
class NN(Chain):
    def __init__(self, n_in, n_units, n_out):
        super(NN, self).__init__()
        with self.init_scope():
            self.l1 = L.Linear(n_in, n_units)
            self.l2 = L.Linear(n_units, n_units)
            self.l3 = L.Linear(n_units, n_out)

    def __call__(self, x):
        h1 = F.relu(self.l1(x))
        h2 = F.relu(self.l2(h1))
        return self.l3(h2)
定数の定義
gpu_device = 0
epoch = 30
batch_size = 512
frequency = -1
n_in = 784
n_units = 100
n_out = 10
学習
model = L.Classifier(NN(n_in, n_units, n_out))
chainer.cuda.get_device_from_id(0)
model.to_gpu()

optimizer = chainer.optimizers.Adam()
optimizer.setup(model)

train_iter = chainer.iterators.SerialIterator(train, batch_size)
test_iter = chainer.iterators.SerialIterator(test, batch_size, repeat=False, shuffle=False)

updater = training.StandardUpdater(train_iter, optimizer, device=gpu_device)
trainer = training.Trainer(updater, (epoch, 'epoch'))

trainer.extend(extensions.Evaluator(test_iter, model,device=gpu_device))
trainer.extend(extensions.dump_graph('main/loss'))

frequency = epoch if frequency == -1 else max(1, frequency)
trainer.extend(extensions.snapshot(), trigger=(frequency, 'epoch'))
trainer.extend(extensions.LogReport())
trainer.extend(
    extensions.PlotReport(['main/loss', 'validation/main/loss'],
                          'epoch', file_name='loss.png'))
trainer.extend(
    extensions.PlotReport(['main/accuracy', 'validation/main/accuracy'],
                          'epoch', file_name='accuracy.png'))
trainer.extend(extensions.PrintReport(
    ['epoch', 'main/loss', 'validation/main/loss',
     'main/accuracy', 'validation/main/accuracy', 'elapsed_time']))

trainer.run()
実行結果
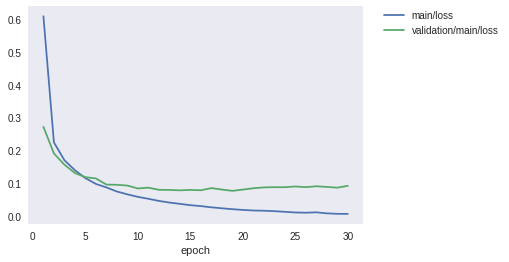
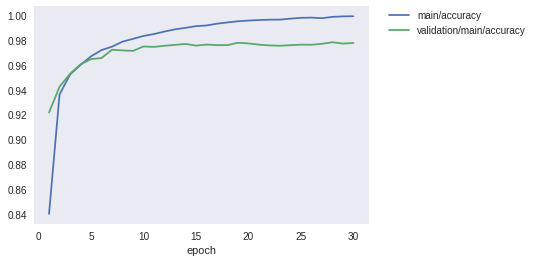
epoch       main/loss   validation/main/loss  main/accuracy  validation/main/accuracy  elapsed_time
1           0.609557    0.271625              0.83986        0.921639                  2.24247
2           0.223956    0.190223              0.936165       0.942412                  3.91926
3           0.169551    0.155889              0.95229        0.952826                  5.49803
4           0.138876    0.130223              0.960069       0.960507                  7.12243
5           0.114769    0.117665              0.966947       0.964746                  8.73528
6           0.096983    0.113826              0.971994       0.965614                  10.3822
7           0.0863535   0.0950723             0.97476        0.972306                  11.9649
8           0.0738427   0.0943972             0.978816       0.971743                  13.6363
9           0.0651506   0.0920507             0.98107        0.971375                  15.2552
10          0.0575137   0.0831638             0.983407       0.97492                   16.8571
11          0.0515834   0.0856705             0.984938       0.974575                  18.4335
12          0.0451553   0.0791185             0.986946       0.975506                  20.0122
13          0.0401197   0.0787027             0.988732       0.976201                  21.5908
14          0.0361692   0.0773779             0.989934       0.976982                  23.1778
15          0.0320661   0.0788221             0.991319       0.975615                  24.7676
16          0.0292983   0.0776353             0.99187        0.976459                  26.4491
17          0.0255289   0.0842461             0.99328        0.976017                  28.0744
18          0.0226313   0.0798943             0.994308       0.976005                  29.6888
19          0.0198879   0.0758416             0.995276       0.977935                  31.3053
20          0.0175719   0.079733              0.99581        0.977372                  32.9155
21          0.0158291   0.0838353             0.996244       0.976384                  34.5392
22          0.015166    0.0863985             0.996524       0.975776                  36.1806
23          0.013793    0.0871418             0.996578       0.975494                  37.7816
24          0.0118357   0.0869616             0.997362       0.975982                  39.3604
25          0.00977673  0.0892306             0.998013       0.976373                  40.9641
26          0.00908512  0.0872242             0.998197       0.976298                  42.679
27          0.0102062   0.0899191             0.997732       0.97708                   44.2737
28          0.00712254  0.087929              0.998781       0.978315                  45.8738
29          0.00570363  0.0855932             0.999182       0.977263                  47.4935
30          0.00537472  0.0911612             0.999299       0.977752                  49.1054
学習曲線
from IPython.display import Image, display_png

display_png(Image('result/loss.png'))
display_png(Image('result/accuracy.png'))
予測
import cupy as cp

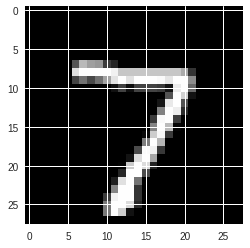
plt.imshow(np.array(test[0][0][0], dtype=np.float32), cmap='gray')
print('この画像データのラベルは{:0d}です。'.format(test[0][1]))
prediction = model.predictor(cp.array(test[0][0][0]).reshape(1, 784))
probability = chainer.cuda.to_cpu(F.softmax(prediction).data[0])
np.set_printoptions(precision=20, floatmode='fixed', suppress=True)
print(probability)
この画像データのラベルは7です。
[0.00000000372259179038 0.00000000087596779830 0.00000003106548618348
 0.00004456961323739961 0.00000000000002767143 0.00000000147911294324
 0.00000000000000000014 0.99994862079620361328 0.00000134408105623152
 0.00000531150408278336]
畳み込みニューラルネットワークでの学習
モデルの定義
class CNN(Chain):
    def __init__(self):
        super(CNN, self).__init__()
        with self.init_scope():
            self.cn1 = L.Convolution2D(1, 20, 5)
            self.cn2 = L.Convolution2D(20, 50, 5)
            self.fc1 = L.Linear(800, 500)
            self.fc2 = L.Linear(500, 10)

    def __call__(self, x):
        h1 = F.max_pooling_2d(F.relu(self.cn1(x)), 2)
        h2 = F.max_pooling_2d(F.relu(self.cn2(h1)), 2)
        h3 = F.dropout(F.relu(self.fc1(h2)))
        return self.fc2(h3)
定数の定義
gpu_device = 0
epoch = 30
batch_size = 512
frequency = -1
学習
model = L.Classifier(CNN())
chainer.cuda.get_device_from_id(0)
model.to_gpu()

optimizer = chainer.optimizers.Adam()
optimizer.setup(model)

train_iter = chainer.iterators.SerialIterator(train, batch_size)
test_iter = chainer.iterators.SerialIterator(test, batch_size, repeat=False, shuffle=False)

updater = training.StandardUpdater(train_iter, optimizer, device=gpu_device)
trainer = training.Trainer(updater, (epoch, 'epoch'))

trainer.extend(extensions.Evaluator(test_iter, model,device=gpu_device))
trainer.extend(extensions.dump_graph('main/loss'))

frequency = epoch if frequency == -1 else max(1, frequency)
trainer.extend(extensions.snapshot(), trigger=(frequency, 'epoch'))
trainer.extend(extensions.LogReport())
trainer.extend(
    extensions.PlotReport(['main/loss', 'validation/main/loss'],
                          'epoch', file_name='loss.png'))
trainer.extend(
    extensions.PlotReport(['main/accuracy', 'validation/main/accuracy'],
                          'epoch', file_name='accuracy.png'))
trainer.extend(extensions.PrintReport(
    ['epoch', 'main/loss', 'validation/main/loss',
     'main/accuracy', 'validation/main/accuracy', 'elapsed_time']))

trainer.run()
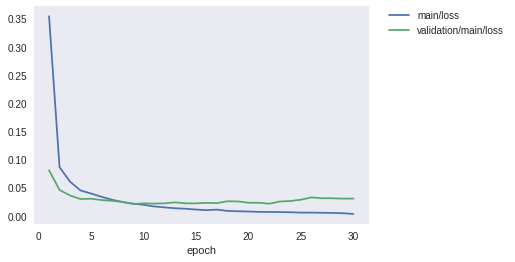
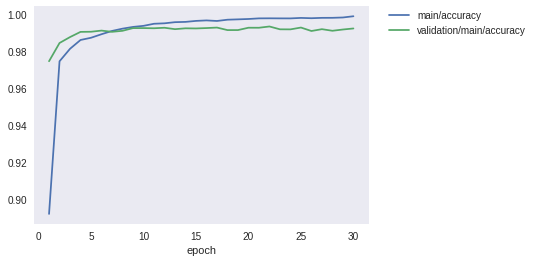
epoch       main/loss   validation/main/loss  main/accuracy  validation/main/accuracy  elapsed_time
1           0.354028    0.0805555             0.892197       0.974782                  2.43793
2           0.0861291   0.0457051             0.97476        0.984651                  5.02699
3           0.0603717   0.0358304             0.98152        0.98785                   7.64132
4           0.0447528   0.029547              0.986278       0.990659                  10.286
5           0.0393856   0.0300916             0.98748        0.990734                  12.9046
6           0.0335107   0.0276662             0.98939        0.991355                  15.5664
7           0.028251    0.0264475             0.991169       0.990682                  18.4082
8           0.024206    0.0245272             0.992405       0.991234                  21.0302
9           0.0213547   0.0207464             0.993339       0.992699                  23.6642
10          0.0193615   0.0218372             0.993924       0.99271                   26.3024
11          0.0163818   0.0214707             0.995051       0.992613                  28.9265
12          0.0147773   0.0218644             0.995292       0.992894                  31.5535
13          0.0131757   0.0236539             0.99591        0.992124                  34.1893
14          0.0123087   0.0218821             0.99606        0.99259                   36.9303
15          0.0108798   0.0218928             0.996595       0.992515                  39.5811
16          0.00979711  0.0227453             0.996862       0.992722                  42.2415
17          0.0107679   0.0222965             0.996557       0.992992                  44.9246
18          0.00846383  0.0256104             0.997246       0.991625                  47.5767
19          0.0078571   0.0252699             0.997429       0.991636                  50.2381
20          0.00736991  0.0229966             0.99763        0.992905                  52.8978
21          0.00675241  0.0229066             0.997963       0.992894                  55.5817
22          0.00664717  0.0212612             0.997997       0.993578                  58.3709
23          0.00643474  0.0251418             0.997963       0.99205                   61.0157
24          0.00604594  0.0260536             0.997947       0.992015                  63.663
25          0.00545904  0.0283221             0.998214       0.993003                  66.3088
26          0.00546739  0.0324786             0.998047       0.991136                  68.9498
27          0.00519143  0.0309123             0.998245       0.992124                  71.6131
28          0.0049064   0.0308791             0.998264       0.991257                  74.2487
29          0.00435375  0.0302761             0.998448       0.99194                   76.9035
30          0.00312136  0.0303936             0.999115       0.992503                  79.5643
学習曲線
from IPython.display import Image, display_png

display_png(Image('result/loss.png'))
display_png(Image('result/accuracy.png'))
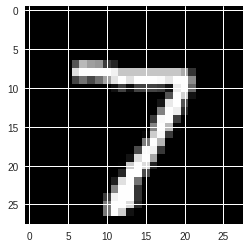
予測
import cupy as cp

plt.imshow(np.array(test[0][0][0], dtype=np.float32), cmap='gray')
print('この画像データのラベルは{:0d}です。'.format(test[0][1]))
prediction = model.predictor(cp.array(test[0][0][0]).reshape(1, 1, 28, 28))
probability = chainer.cuda.to_cpu(F.softmax(prediction).data[0])
np.set_printoptions(precision=20, floatmode='fixed', suppress=True)
print(probability)
この画像データのラベルは7です。
[0.00000000000034654969 0.00000000001631320079 0.00000000017968711241
 0.00000000000952125098 0.00000000180500603353 0.00000000000172482167
 0.00000000000000372396 1.00000000000000000000 0.00000000000094331075
 0.00000000918344689183]
リカレントニューラルネットワークでの学習
定数の定義
gpu_device = 0
epoch = 30
batch_size = 500
frequency = -1
モデルの定義
class RNN(Chain):
    def __init__(self):
        super(RNN, self).__init__()
        with self.init_scope():
            self.w1 = L.Linear(784, 100)
            self.h1 = L.Linear(100, 100)
            self.o = L.Linear(100, 10)

    def reset_state(self):
        self.last_z = chainer.Variable(cp.zeros((batch_size, 100), dtype=np.float32))

    def __call__(self, x):
        z = F.relu(self.w1(x) + self.h1(self.last_z))
        self.last_z = z
        y = F.relu(self.o(z))
        return y
学習
rnn = RNN()
rnn.reset_state()
model = L.Classifier(rnn)
chainer.cuda.get_device_from_id(0)
model.to_gpu()

optimizer = chainer.optimizers.Adam()
optimizer.setup(model)
optimizer.add_hook(chainer.optimizer.GradientClipping(10.0))

train_iter = chainer.iterators.SerialIterator(train, batch_size)
test_iter = chainer.iterators.SerialIterator(test, batch_size, repeat=False, shuffle=False)

updater = training.StandardUpdater(train_iter, optimizer, device=gpu_device)
trainer = training.Trainer(updater, (epoch, 'epoch'))

trainer.extend(extensions.Evaluator(test_iter, model,device=gpu_device))
trainer.extend(extensions.dump_graph('main/loss'))

frequency = epoch if frequency == -1 else max(1, frequency)
trainer.extend(extensions.snapshot(), trigger=(frequency, 'epoch'))
trainer.extend(extensions.LogReport())
trainer.extend(
    extensions.PlotReport(['main/loss', 'validation/main/loss'],
                          'epoch', file_name='loss.png'))
trainer.extend(
    extensions.PlotReport(['main/accuracy', 'validation/main/accuracy'],
                          'epoch', file_name='accuracy.png'))
trainer.extend(extensions.PrintReport(
    ['epoch', 'main/loss', 'validation/main/loss',
     'main/accuracy', 'validation/main/accuracy', 'elapsed_time']))

trainer.run()
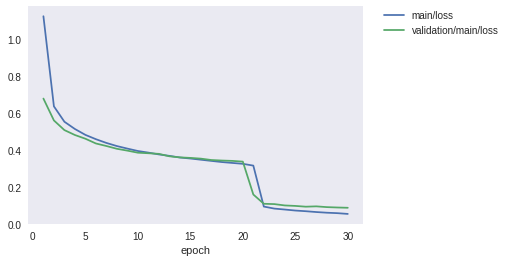
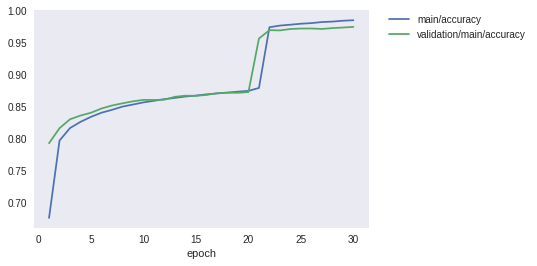
epoch       main/loss   validation/main/loss  main/accuracy  validation/main/accuracy  elapsed_time
1           1.12647     0.67986               0.676317       0.7929                    14.2889
2           0.637657    0.561256              0.7971         0.8164                    28.7837
3           0.554199    0.508853              0.816633       0.8303                    43.3512
4           0.514805    0.482239              0.826266       0.8361                    57.8673
5           0.482919    0.462028              0.834117       0.8405                    72.5115
6           0.459542    0.436305              0.84055        0.8471                    87.0379
7           0.439237    0.422526              0.845017       0.8518                    101.544
8           0.422248    0.407439              0.850083       0.8552                    116.104
9           0.408515    0.397422              0.853317       0.8583                    130.608
10          0.395496    0.386185              0.856666       0.8606                    145.18
11          0.386715    0.383238              0.859083       0.8604                    159.626
12          0.376893    0.380003              0.861716       0.8609                    174.196
13          0.369096    0.366671              0.863667       0.8654                    188.681
14          0.36017     0.360889              0.865816       0.8671                    203.158
15          0.35465     0.358045              0.867233       0.8669                    217.71
16          0.348177    0.354098              0.8692         0.8683                    232.215
17          0.341731    0.346596              0.870567       0.871                     246.759
18          0.335474    0.343758              0.872          0.8717                    261.409
19          0.330673    0.341848              0.873383       0.8716                    275.912
20          0.325912    0.337807              0.874617       0.8728                    290.407
21          0.316205    0.159358              0.879183       0.9563                    305.075
22          0.094005    0.109159              0.97395        0.9694                    319.652
23          0.0830744   0.107424              0.976567       0.969                     334.165
24          0.0779403   0.100136              0.977933       0.9712                    348.725
25          0.0724973   0.0975639             0.97945        0.9719                    363.134
26          0.0687905   0.0933854             0.980384       0.972                     377.548
27          0.0643198   0.0951944             0.98205        0.9713                    392.084
28          0.060734    0.0910737             0.98275        0.9726                    406.522
29          0.0582916   0.089033              0.9841         0.9735                    421.009
30          0.0541574   0.0874746             0.984867       0.9745                    435.481
学習曲線
from IPython.display import Image, display_png

display_png(Image('result/loss.png'))
display_png(Image('result/accuracy.png'))
参考
リカレントニューラルネットワークのChainerでの実装について、下記ページを参考にいたしました。
https://qiita.com/knok/items/3077230a9dc6b7979173
