はじめてに
d3.js アドベントカレンダー1日目でd3.jsがメインじゃないじゃないか!!と言われるかもしれませんが、
この記事はd3.jsを使った記事です!!ごめんなさい。Meteor面白そうだったのでどうしても触ってみたかったのです。
MeteorとはNode.jsのリアクティブ・フレームワークです。
MongoDBもセットでついてきます。
WebSocketを使用しているらしく、他のユーザと画面を同期することができます。
また、DBやSession情報の監視機能があり、変更があった場合、即時画面に反映させることができます。
d3.jsでデータ分析画面を作る場合、
管理画面や、ユーザ管理を作る必要があると思いますが、
それらもrailsのgemに似た、packageとして幾つか用意されているものがあるので非常に便利だと感じました。
また、d3.jsを使用していて、公開したい場合、
いつもGistを利用していたのですが、
動的なもの、例えばゲームのようなものを作ろうと思った場合に、どうしても無理があるな〜と思っていました。
今回はd3.jsの拡張版であるNVD3を使っています。
Meteorのインストールからデプロイ
インストール
curl https://install.meteor.com/ | sh
プロジェクトを新しく作る
meteor create nvd3-sample
アプリの起動
cd nvd3-sample
meteor
パッケージの追加
meteor add mizzao:bootstrap-3
meteor add pfafman:nvd3
アプリのデプロイ
meteor deploy my_app_name.meteor.com
参考にしたURL
1日METEORを触って非常に勉強になりました。
http://qiita.com/abe00makoto/items/90d05c22353d9c271fbf
http://qiita.com/abe00makoto/items/d67fc9b732f0d3737470
http://qiita.com/abe00makoto/items/3b576ace584b8cf4920d
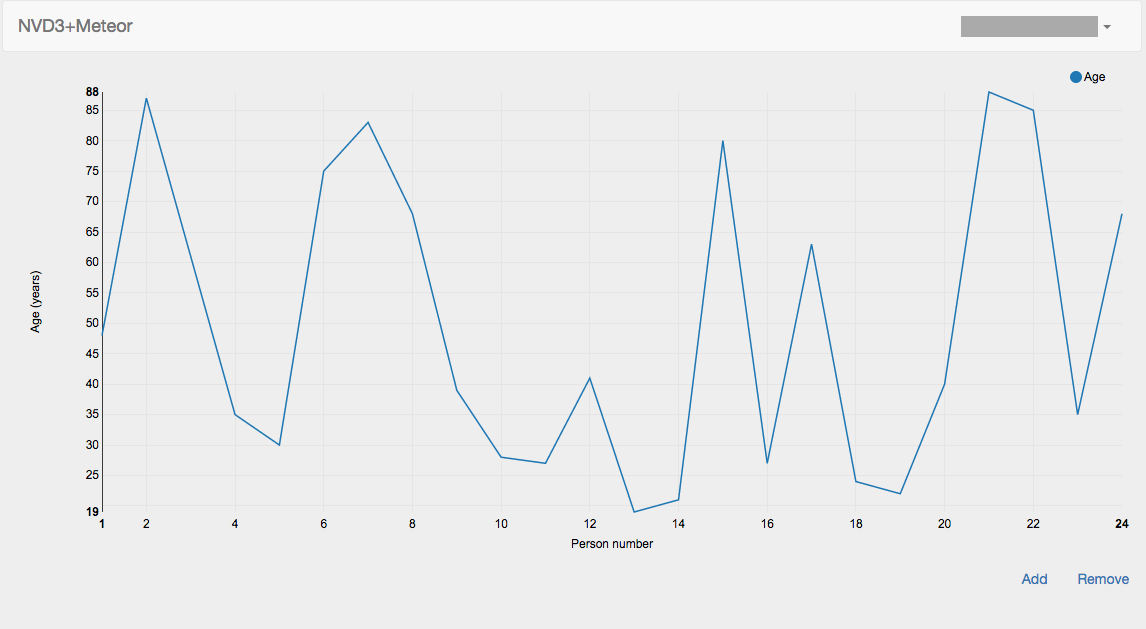
nvd3を使ったリアルタイムに反映されるグラフ
いまいち何を作ろうか思いつかなかったので、こちらのサンプルを少し改良してみました。
https://gitlab.com/meonkeys/meteor-reactive-nvd3-js-graph/tree/master
改修後はこちらにソースを格納しました。
デモ
みんなでデータを増やしていくと面白いかも!!
右上にログインボタンがあり、ログインするとデータが追加・削除ができるようになります。
bootstrap適用、ログイン機能とログインユーザのみデータの追加削除ができるようにしてみました。
このサンプルは簡単な作りになっています。Meteorのチュートリアルの作り方では以下のようなファイル構造で開発するのですが、今回はサーバもクライアントの処理も1つのJavaScriptファイルに記載しております。
/server
/client
/public
/lib
下準備
ログイン用のパッケージを導入します。
meteor add ian:accounts-ui-bootstrap-3 #accounts-uiのbootstrap版
meteor add accounts-password
クライアント+サーバの処理
// mongodbでコレクションを作成
People = new Meteor.Collection("people");

function getRandomInt(min, max) {
  return Math.floor(Math.random() * (max - min + 1)) + min;
}

if (Meteor.isClient) {
  Template.hello.rendered = function() {
    var chart = nv.models.lineChart()
      .margin({left: 100})  //Adjust chart margins to give the x-axis some breathing room.
      .useInteractiveGuideline(true)  //We want nice looking tooltips and a guideline!
      .transitionDuration(350)  //how fast do you want the lines to transition?
      .showLegend(true)       //Show the legend, allowing users to turn on/off line series.
      .showYAxis(true)        //Show the y-axis
      .showXAxis(true)        //Show the x-axis
    ;

    nv.addGraph(function() {
      chart.xAxis.axisLabel('Person number').tickFormat(d3.format('d'));
      chart.yAxis.axisLabel('Age (years)').tickFormat(d3.format('d'));
      d3.select('#chart svg').datum(
        [{ values: People.find().fetch(), key: 'Age' }]
      ).call(chart);
      nv.utils.windowResize(function() { chart.update() });
      return chart;
    });

    //Deps.autorunはデータの変化を監視している
    //ボタンを押下してデータの増減があった場合にチャートを更新する
    Deps.autorun(function () {
      d3.select('#chart svg').datum(
        [{ values: People.find().fetch(), key: 'Age' }]
      ).call(chart);
      chart.update();
    });
  };

  Template.hello.events({
    'click #addDataButton': function() {
      var age = getRandomInt(13, 89);
      var lastPerson = People.findOne({}, {fields:{x:1},sort:{x:-1},limit:1,reactive:false});
      if (lastPerson) {
        People.insert({x:(lastPerson.x + 1), y:age});
      } else {
        People.insert({x:1, y:age});
      }
    },
    'click #removeDataButton': function() {
      var lastPerson = People.findOne({}, {fields:{x:1},sort:{x:-1},limit:1,reactive:false});
      if (lastPerson) {
        People.remove(lastPerson._id);
      }
    }
  });
}

if (Meteor.isServer) {
  Meteor.startup(function () {
    // code to run on server at startup
  });
}
画面
<head>
  <title>nvd3js-test</title>
</head>

<body>
  <div class="container">
    {{> header}}
    <div id="main" class="row-fluid">
      {{> hello}}
    </div>
  </div>
</body>

<!-- meteorにはテンプレート機能があり、nameでjsのrenderedと対応付けている -->
<template name="header">
  <nav class="navbar navbar-default" role="navigation">
    <div class="container-fluid">
      <div class="navbar-header">
        <a class="navbar-brand" href="/">NVD3+Meteor</a>
      </div>
      <div class="collapse navbar-collapse" id="navigation">
        <ul class="nav navbar-nav navbar-right">
          {{> loginButtons}}
        </ul>
      </div>
    </div>
  </nav>
</template>

<template name="hello">
  <div id="chart">
    <svg style="height:500px;"/>
  </div>
  <div style="text-align:right;">
    {{#if currentUser}}
      <a class="btn" href="#" id="addDataButton">Add</a>
      <a class="btn" href="#" id="removeDataButton">Remove</a>
    {{/if}}
  </div>
</template>
CSS
grid-block, .main, .post, .comments li, .comment-form {
  background: #fff;
  -webkit-border-radius: 3px;
  -moz-border-radius: 3px;
  -ms-border-radius: 3px;
  -o-border-radius: 3px;
  border-radius: 3px;
  padding: 10px;
  margin-bottom: 10px;
  -webkit-box-shadow: 0 1px 1px rgba(0, 0, 0, 0.15);
  -moz-box-shadow: 0 1px 1px rgba(0, 0, 0, 0.15);
  box-shadow: 0 1px 1px rgba(0, 0, 0, 0.15); }

body {
  background: #eee;
  color: #666666; }

.navbar {
  margin-bottom: 10px; }
  /* line 32, ../sass/style.scss */
  .navbar .navbar-inner {
    -webkit-border-radius: 0px 0px 3px 3px;
    -moz-border-radius: 0px 0px 3px 3px;
    -ms-border-radius: 0px 0px 3px 3px;
    -o-border-radius: 0px 0px 3px 3px;
    border-radius: 0px 0px 3px 3px; }
おわり
meteorは個人的にはなにかすごいものに触ったんじゃないかと衝撃を受けています。
今回はサンプルをちょこっと改良させただけでしたが、
次は軸の設定をmongoに保存させたり、
例えば、編集状態を保持しておけるような画面を作ってみたいなと思います。
まだd3.jsアドベントカレンダーには空きがあるので、
時間があれば、もう少しd3.jsな記事を書きたいと思います。

