この記事はD3.jsのAdvent Calendar 2016年の2日目の記事です。
昨日はD3はReactのプロジェクトで扱いにくいという話しをしたのですが、
今日は、それでもReactのプロジェクトでD3を使いたい場合にどうするかをコード共に書いていきます。
ReactのプロジェクトでD3を利用するには以下の3つ方法がある(他にもあるかも)のですが、
そのうちの1番目の方法で試す方法を書いていきます。
- ReactのComponentDidMount時に直接DOMを書き出す
- DOMの書き出しはD3を使わず、自分で書き、ScaleやColor、Max、Minなどの計算やデータ操作で利用する
- jsdomを利用する ※未検証
Reactプロジェクトの作成
以前はReactをプロジェクトに導入する場合、
WebpackやBabelなどを設定する必要があるため、導入自体が難しかったのですが、
今はcreate-react-appで簡単に導入することができます。
「あと少しでHello Worldができるぞ」と言うツイートが流れて来たときはかなりウケましたw
では実際にプロジェクトを作成していきます。
$ npm install -g create-react-app
$ create-react-app d3-react-example
$ cd d3-react-example
$ npm start
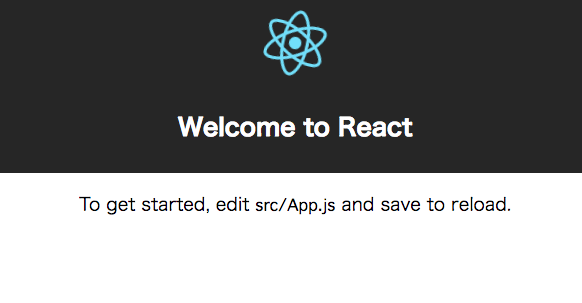
http://localhost:3000 でブラウザに「Welcome to React」と表示されれば準備完了です。
BubbleChartを描画してみる
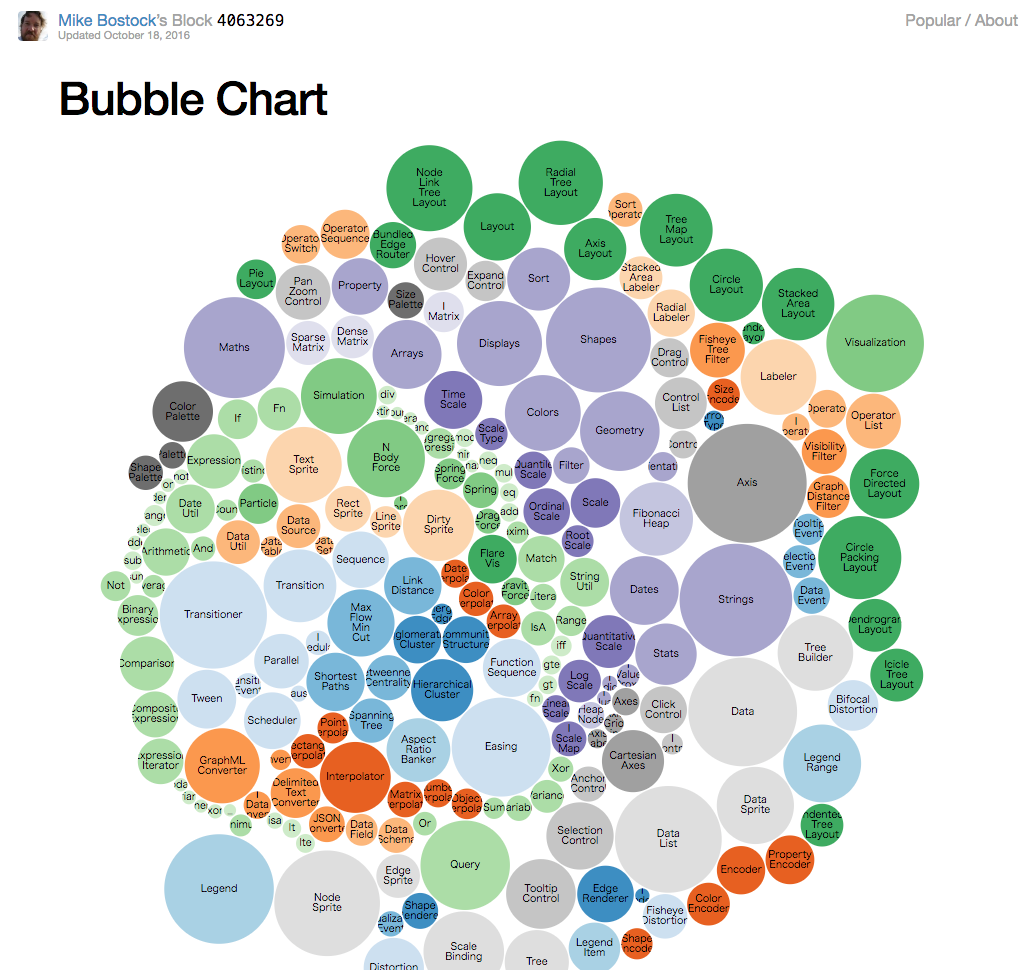
こちらのBubbleチャートがv4で書かれているので、Reactプロジェクトで描画していきたいと思います。
d3.js をインストール
$ npm install --save d3
flare.csv をダウンロード
Gistからダウンロードします。
$ wget -P public/ https://gist.githubusercontent.com/mbostock/4063269/raw/acafd4305293814cdc87a403354a3583075b5b09/flare.csv
App.jsを修正
d3をインポートし、Renderの中にsvgタグを入れます。
d3はv4からモジュール化されているので、個別に呼び出すこともできます。
$ vim src/App.js

import React, { Component } from 'react';
import * as d3 from 'd3';
import './App.css';

class App extends Component {

  render() {
    return (
      <div className="App">
        <svg width="960" height="880"></svg>
      </div>
    );
  }
}

export default App;
drawBubbleChartメソッドを作成し既存のソースをそのままコピペします。
その後、ComponentDidMountメソッド時に呼んでみます。
$ vim src/App.js

import React, { Component } from 'react';
import * as d3 from 'd3';
import './App.css';

class App extends Component {

  componentDidMount() {
    drawBubbleChart();
  }

  render() {
    return (
      <div className="App">
        <svg width="960" height="880"></svg>
      </div>
    );
  }
}

function drawBubbleChart() {
  var svg = d3.select("svg"),
    width = +svg.attr("width");

  var format = d3.format(",d");

  var color = d3.scaleOrdinal(d3.schemeCategory20c);

  var pack = d3.pack()
      .size([width, width])
      .padding(1.5);

  d3.csv("flare.csv", function(d) {
    d.value = +d.value;
    if (d.value) return d;
  }, function(error, classes) {
    if (error) throw error;

    var root = d3.hierarchy({children: classes})
        .sum(function(d) { return d.value; })
        .each(function(d) {
          if (id = d.data.id) {
            var id, i = id.lastIndexOf(".");
            d.id = id;
            d.package = id.slice(0, i);
            d.class = id.slice(i + 1);
          }
        });

    var node = svg.selectAll(".node")
      .data(pack(root).leaves())
      .enter().append("g")
        .attr("class", "node")
        .attr("transform", function(d) { return "translate(" + d.x + "," + d.y + ")"; });

    node.append("circle")
        .attr("id", function(d) { return d.id; })
        .attr("r", function(d) { return d.r; })
        .style("fill", function(d) { return color(d.package); });

    node.append("clipPath")
        .attr("id", function(d) { return "clip-" + d.id; })
      .append("use")
        .attr("xlink:href", function(d) { return "#" + d.id; });

    node.append("text")
        .attr("clip-path", function(d) { return "url(#clip-" + d.id + ")"; })
      .selectAll("tspan")
      .data(function(d) { return d.class.split(/(?=[A-Z][^A-Z])/g); })
      .enter().append("tspan")
        .attr("x", 0)
        .attr("y", function(d, i, nodes) { return 13 + (i - nodes.length / 2 - 0.5) * 10; })
        .text(function(d) { return d; });

    node.append("title")
        .text(function(d) { return d.id + "\n" + format(d.value); });
  });
}

export default App;
最後にCSSを修正します。
$ vim src/App.css

.App {
  text-align: center;
}

text {
  font: 10px sans-serif;
  text-anchor: middle;
}
お疲れ様でした。
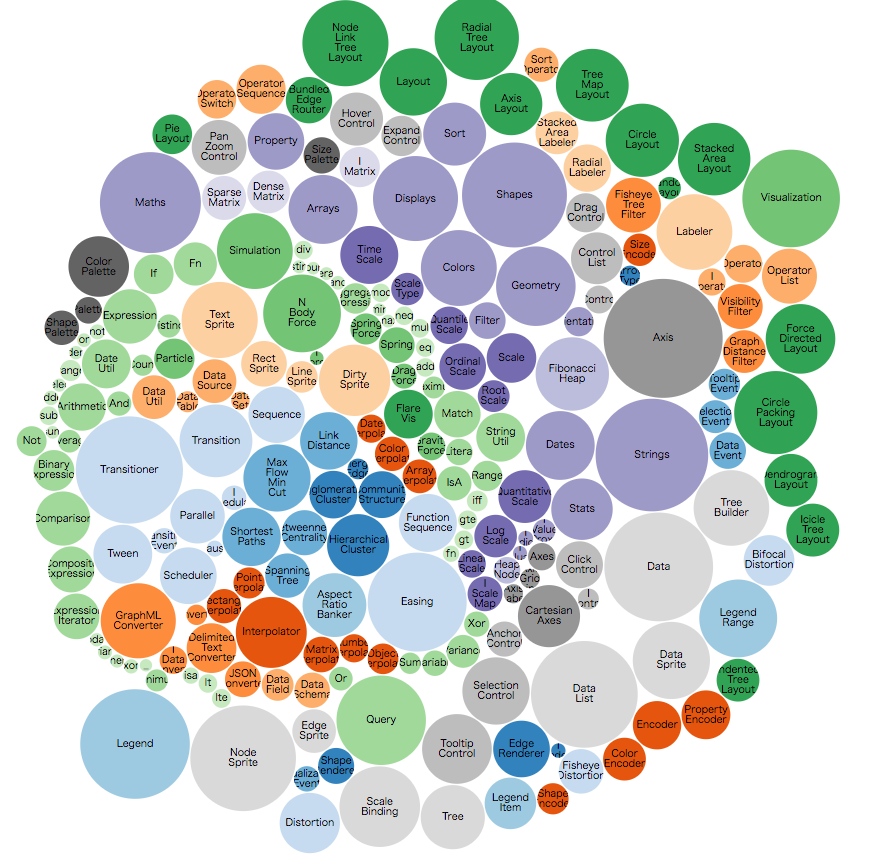
もう一度ブラウザでhttp://localhost:3000 を表示するとバブルチャートが表示されます。
まとめ
このやり方だと、既存のコードを活かすことができるので、
導入が簡単なのですが、D3のメソッドでDOMを直接修正することになります。
また、他のDOMも修正できてしまうため、あまりオススメできません。
そのため、次の記事では方法2の「DOMの書き出しはD3を使わず、自分で書き、ScaleやColor、Max、Minなどの計算やデータ操作で利用する」について書いていきたいと思います。
続く。


