pandas, Matplotlib(mpl_finance)でローソク足チャートを作成しPyQt5で表示
pandasとMatplotlib(mpl_finance)を使ってローソク足チャート(Candlestick chart)を作成
pandasとMatplotlib(mpl_finance)を使ってローソク足チャート(Candlestick chart)を描画・作成する方法について説明したサイトがあります。
チャート作成方法はこちらのサイトを参照にしてください。
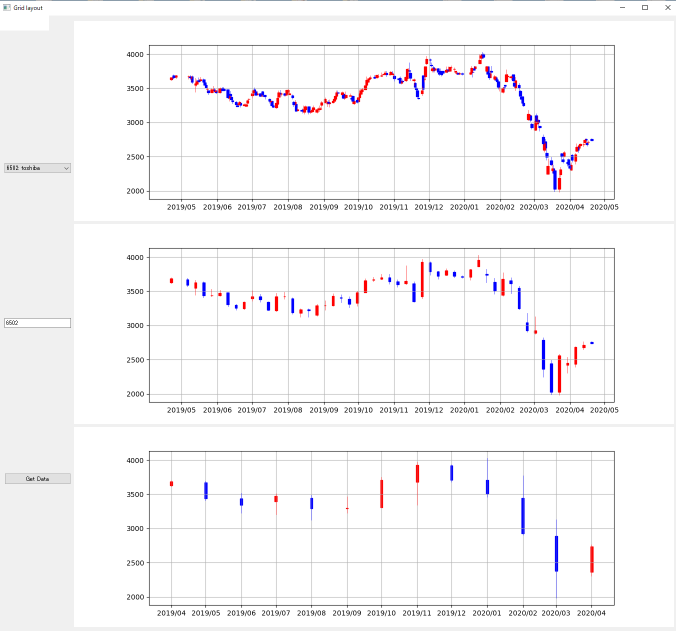
PyQt5で会社を選択して株価データをダウンロードしローソク足チャートを表示するプログラムを作成
PyQt5の勉強のため作成しました、3日でこのレベルまで到達できました。
プログラム
Kabuka4.py
# =============================================
# Kabuka
# Purpose:PyQt5 GUI Chart
#
# Author:      Tsuyoshi Fujioka
# Copyright:   (c) T.F. 2020
#
# Created:     Ver.1 2020/4/19
# Ver up:      Ver.2 2020/4/20
#              Ver.3 2020/4/21  multi Layout
#              Ver.4 2020/4/21  use QComboBox
#
#
# =============================================
# ==============================================
#  Import
# ==============================================
import sys
import time
import datetime
import math
# ---------------------------------
import pandas_datareader.data as web
import matplotlib.pyplot as plt
# ---------------------------------
import matplotlib.dates as mdates
import mpl_finance as mpf
# ---------------------------------
from PyQt5.QtWidgets import QApplication, QWidget
from PyQt5.QtWidgets import QGridLayout, QVBoxLayout, QHBoxLayout, QFormLayout
from PyQt5.QtWidgets import QPushButton, QLabel, QLineEdit, QMessageBox
from PyQt5.QtWidgets import QComboBox,QSlider
# ....................................
from PyQt5.QtGui import QPixmap
from PyQt5.QtCore import Qt

# ==============================================
# 株価取得 チャート作成
# ==============================================
class Kabuka():
    #=====================
    #
    #=====================
    def __init__(self):
        super().__init__()

    def getdata(self,ID):
        #==============================================
        # グラフ作成
        #==============================================
        def plot(n,df):
            df.index = mdates.date2num(df.index)
            data = df.reset_index().values
            #-------------------------------------
            fig = plt.figure(figsize=(12, 4))
            ax = fig.add_subplot(1, 1, 1)
            #-------------------------------------
            mpf.candlestick_ohlc(ax, data, width=2, alpha=1.0, colorup='r', colordown='b')
            #-------------------------------------
            ax.grid()
            #--------------------------------------------------------
            # Auto locator
            #--------------------------------------------------------
            ##locator = mdates.AutoDateLocator()
            ##ax.xaxis.set_major_locator(locator)
            ##ax.xaxis.set_major_formatter(mdates.AutoDateFormatter(locator))
            #--------------------------------------------------------
            # Manual locator
            #--------------------------------------------------------
            ax.xaxis.set_major_locator(mdates.MonthLocator())
            ax.xaxis.set_major_formatter(mdates.DateFormatter('%Y/%m'))
            ##ax.xaxis.set_major_formatter(mdates.DateFormatter('%Y'))
            #--------------------------------------------------------
            # save image
            #--------------------------------------------------------
            if n==0:
                plt.savefig('candlestick_day.png')
            elif n==1:
                plt.savefig('candlestick_week.png')
            elif n==2:
                plt.savefig('candlestick_month.png')
            elif n==3:
                plt.savefig('candlestick_quator.png')

            #plt.show()

        #----------------------------------------------
        # Stooq is Porland Sight
        #----------------------------------------------
        #df=web.DataReader('6758.JP', 'stooq') #sony
        df=web.DataReader(ID+'.JP', 'stooq') #ID

        #----------------------------------------------
        # 最新データ〇〇行を表示
        #----------------------------------------------
        df=df.head(240)
        print(df.head(10))

        #----------------------------------------------
        # 終値 単純プロット
        #----------------------------------------------
        ##df_u = df.unstack(0)
        ##df_u['Close'].plot(title='Kabuka', grid=True)
        ##plt.show()

        #==============================================
        # ローソク足:日足、週足・月足・四半期
        #==============================================
        d_ohlcv = {'Open': 'first',
                   'High': 'max',
                   'Low': 'min',
                   'Close': 'last',
                   'Volume': 'sum'}

        #----------------------------------------------
        # 日足
        #----------------------------------------------
        df_d = df.copy()
        #----------------------------------------------
        # 週足
        #----------------------------------------------
        df_w = df.resample('W-MON', closed='left', label='left').agg(d_ohlcv).copy()
        #----------------------------------------------
        # 月足
        #----------------------------------------------
        df_m = df.resample('MS', closed='left', label='left').agg(d_ohlcv).copy()
        #----------------------------------------------
        # 四半期
        #----------------------------------------------
        df_q = df.resample('QS', closed='left', label='left').agg(d_ohlcv).copy()

        #==============================================
        # ローソク足:日足、週足、月足、四半期足
        #==============================================
        plot(0,df_d)
        plot(1,df_w)
        plot(2,df_m)
        plot(3,df_q)

# ==================================
# グラフ表示 GUI
# ==================================
class MainWindow(QWidget):
    #=====================
    #
    #=====================
    def __init__(self):
        super().__init__()
        self.initUI()
    #=====================
    #
    #=====================
    def initUI(self):
        #=====================
        #
        #=====================
        #-------------------------------------------------------
        self.combo = QComboBox(self)
        self.combo.addItem("1320: daiwa255")
        self.combo.addItem("6501: hitachi")
        self.combo.addItem("6502: toshiba")
        self.combo.addItem("6503: mitsubishi")
        self.combo.addItem("6504: fuji")
        self.combo.addItem("6506: yaskawa")
        self.combo.addItem("6508: meidensha")
        self.combo.addItem("6752: panasonic")
        self.combo.addItem("6758: sony")

        #--------------------------------------
        self.IDLineEdit = QLineEdit()
        self.getButtonID = QPushButton("&Get Data")
        #--------------------------------------
        self.label1 = QLabel(self)
        self.label1.setPixmap(QPixmap("candlestick_day.png"))
        #-------------------------------------------------------
        self.label2 = QLabel(self)
        self.label2.setPixmap(QPixmap("candlestick_week.png"))
        #-------------------------------------------------------
        self.label3 = QLabel(self)
        self.label3.setPixmap(QPixmap("candlestick_month.png"))
        #-------------------------------------------------------
        self.label4 = QLabel(self)
        self.label4.setPixmap(QPixmap("candlestick_quator.png"))

        #=====================
        #
        #=====================
        buttonLayout = QVBoxLayout()
        #......................................
        buttonLayout.addWidget(self.combo)
        buttonLayout.addWidget(self.IDLineEdit)
        buttonLayout.addWidget(self.getButtonID)
        #......................................
        self.getButtonID.clicked.connect(self.getDataID)
        self.combo.activated[str].connect(self.onActivated)
        #=====================
        #
        #=====================
        grid = QGridLayout()
        #......................................
        grid.addWidget(self.label1, 0, 0)
        grid.addWidget(self.label2, 1, 0)
        grid.addWidget(self.label3, 2, 0)
        #=====================
        #
        #=====================
        mainLayout = QHBoxLayout()
        mainLayout.addLayout(buttonLayout)
        mainLayout.addLayout(grid)
        #-------------------------------------------------------
        self.setWindowTitle('Grid layout')
        self.setLayout(mainLayout)

        ##self.show() or main_window.show()

    #=====================
    #
    #=====================
    def getDataID(self):
        ID = self.IDLineEdit.text()
        if ID == "":
            QMessageBox.critical(self, "Empty Field", "Please enter a ID code!")
        else:
            start=time.time()
            kabu.getdata(ID)
            self.label1.setPixmap(QPixmap("candlestick_day.png"))
            self.label2.setPixmap(QPixmap("candlestick_week.png"))
            self.label3.setPixmap(QPixmap("candlestick_month.png"))
            self.label4.setPixmap(QPixmap("candlestick_quator.png"))
            end=time.time()
            dt=end - start
            dt_int=int(dt)
            dt_2f=round(dt,2)
            QMessageBox.information(self, "Finish!"," Get ID = %s \n time = %.2f sec" %(ID,dt_2f))
            print(f"経過時間:{dt_2f}秒")
    #=====================
    #
    #=====================
    def onActivated(self, text):
        self.IDLineEdit.setText(text[:4])
# ==================================
#
# ==================================
if __name__ == '__main__':
    #-------------------------
    #1320: ダイワ上場投信-日経225
    #-------------------------
    kabu=Kabuka()
    kabu.getdata('1320')
    #-------------------------
    qApp = QApplication(sys.argv)
    main_window = MainWindow()
    main_window.show()
    #-------------------------
    sys.exit(qApp.exec_())
取り急ぎ、出来立てほやほやのプログラムを掲載しました。(2020/04/21)
後日、解説を加えて、備忘録にします。
皆様も参考にしてください。