今回は scikit-learn の データセット生成を試してみます。
回帰データセット生成
make_regression
sklearn.datasets.make_regression クラスを使用します。
引数
| 引数 | 内容 |
|---|---|
| n_samples | サンプル数 |
| n_features | 特徴量の数 |
| n_informative | 目的変数のラベルと相関が強い特徴量の数 |
| noise | ガウシアンノイズの標準偏差 |
| bias | バイアス(切片) |
| coef | True設定時、基礎となる線形モデルの重みを返却 (default=False) |
インポート
%matplotlib inline
import numpy as np
import pandas as pd
import matplotlib.pyplot as plt
データセット生成
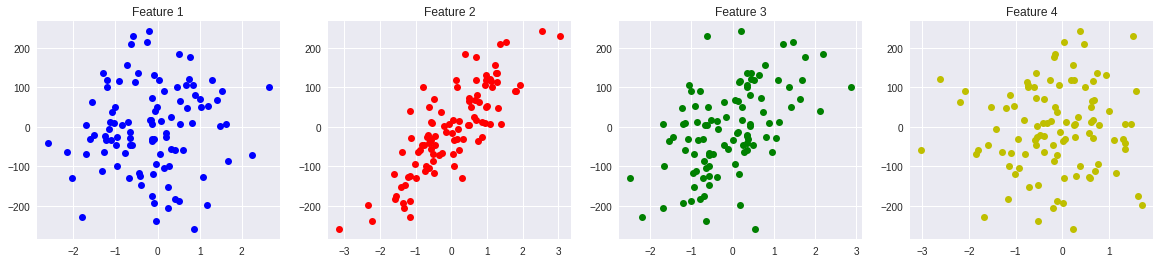
特徴量の数を 4、目的変数に対して相関の強い特徴量の数を 2、
ノイズを 10.0 に設定してデータセットを生成します。
from sklearn.datasets import make_regression

X, Y, coef = make_regression(random_state=12,
                       n_samples=100,
                       n_features=4,
                       n_informative=2,
                       noise=10.0,
                       bias=-0.0,
                       coef=True)

print("X =", X[:5])
print("Y =", Y[:5])
print("coef =", coef)

plt.figure(figsize=(20, 4))
plt.subplot(1, 4, 1)
plt.title("Feature 1")
plt.plot(X[:, 0], Y, "bo")
plt.subplot(1, 4, 2)
plt.title("Feature 2")
plt.plot(X[:, 1], Y, "ro")
plt.subplot(1, 4, 3)
plt.title("Feature 3")
plt.plot(X[:, 2], Y, "go")
plt.subplot(1, 4, 4)
plt.title("Feature 4")
plt.plot(X[:, 3], Y, "yo")
以下のようなデータが出力されます。
X = [[-1.51308726 -0.66429757  0.35133554 -0.48403143]
 [-1.78809425 -1.15436024 -2.21333348 -1.68175651]
 [-1.08851741 -0.29182345  0.73414765 -0.12549567]
 [-0.12022767  0.75314283 -1.53472134  0.00512708]
 [-0.08552138  0.33139302 -1.07281476  1.28944858]]
Y = [ -19.76575122 -227.36295209   38.25387403  -34.67388071  -31.76298106]
coef = [ 0.         88.25898063 63.26534186  0.        ]
プロットを表示してみると、赤と緑のプロットが相関のある特徴量となっています。
分類データセット生成
make_blobs
sklearn.datasets.make_blobs クラスを使用します。
引数
| 引数 | 内容 |
|---|---|
| n_samples | サンプル数 |
| n_features | 特徴量の数 |
| centers | 中心の個数(塊数) |
| cluster_std | クラスタの標準偏差 |
データセット生成
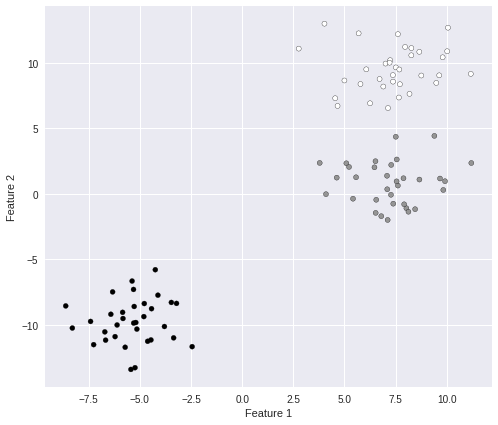
特徴量の数を 2、塊数を3 に設定してデータセットを生成します。
####################################
# ブロブデータ生成
####################################
from sklearn.datasets import make_blobs

X, Y = make_blobs(random_state=8,
                  n_samples=100,
                  n_features=2,
                  cluster_std=1.5,
                  centers=3)

print("X =", X[:3])
print("Y =", Y)

plt.figure(figsize=(8, 7))
plt.scatter(X[:, 0], X[:, 1], marker='o', c=Y, s=25, edgecolor='k')
plt.xlabel("Feature 1")
plt.ylabel("Feature 2")
以下のようなデータが出力されます。
X = [[ -6.71102744 -10.55634522]
 [ -5.23444824 -13.29219851]
 [ -7.25731608 -11.53143949]]
Y = [2 2 2 0 2 0 2 2 2 1 0 0 1 2 2 0 0 2 1 1 0 0 0 0 1 1 2 2 1 2 0 1 1 0 1 2 0
 2 1 1 2 1 0 1 0 1 0 0 2 0 0 2 1 0 2 2 0 1 0 1 1 2 1 0 2 1 0 0 0 1 0 1 0 0
 2 2 2 1 1 0 2 2 2 2 0 1 2 0 0 2 1 1 1 1 2 1 1 2 0 1]
塊が3つ表示されました。
make_classification
sklearn.datasets.make_classification クラスを使用します。
引数
| 引数 | 内容 |
|---|---|
| n_samples | サンプル数 |
| n_features | 特徴量の数 |
| n_informative | 目的変数のラベルと相関が強い特徴量の数 |
| n_clusters_per_class | 1クラスのクラスタ数 |
| n_classes | 分類クラス数 |
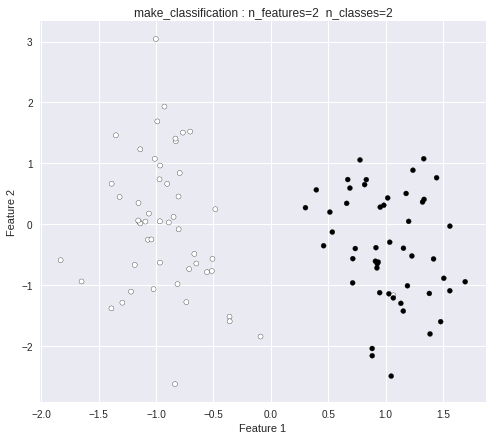
データセット生成(2クラス)
from sklearn.datasets import make_classification

####################################
# 2クラス分類
####################################
X, Y = make_classification(random_state=12,
                           n_features=2,
                           n_redundant=0,
                           n_informative=1,
                           n_clusters_per_class=1,
                           n_classes=2)
print("X =", X[:3])
print("Y =", Y[:20])

plt.figure(figsize=(8, 7))
plt.title("make_classification : n_features=2  n_classes=2")
plt.scatter(X[:, 0], X[:, 1], marker='o', c=Y, s=25, edgecolor='k')
plt.xlabel("Feature 1")
plt.ylabel("Feature 2")
以下のようなデータが出力されます。
X = [[-1.38809422 -1.37759603]
 [-0.66625812 -0.48403143]
 [-1.07009269 -0.25080271]]
Y = [0 0 0 1 0 1 1 0 1 0 1 0 0 1 0 1 0 1 0 0]
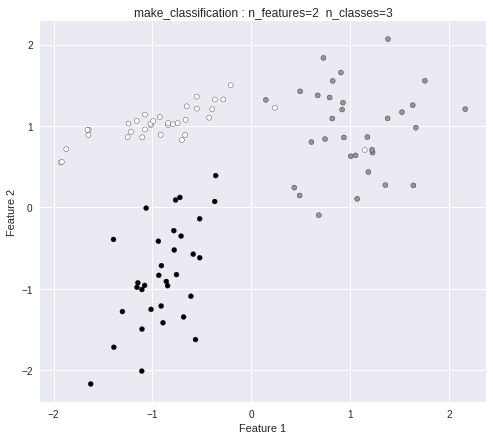
データセット生成(3クラス)
####################################
# 3クラス分類
####################################
X, Y = make_classification(random_state=11,
                           n_features=2,
                           n_redundant=0,
                           n_informative=2,
                           n_clusters_per_class=1,
                           n_classes=3)
print("X =", X[:3])
print("Y =", Y[:20])

plt.figure(figsize=(8, 7))
plt.title("make_classification : n_features=2  n_classes=3")
plt.scatter(X[:, 0], X[:, 1], marker='o', c=Y, s=25, edgecolor='k')
plt.xlabel("Feature 1")
plt.ylabel("Feature 2")
以下のようなデータが出力されます。
3クラス分類のデータになっています。
X = [[-0.76615642  0.09045822]
 [ 1.35779151  0.27391384]
 [-1.15957914  1.06208186]]
Y = [2 1 0 1 0 1 0 0 2 2 0 0 0 0 1 1 2 1 2 2]
make_gaussian_quantiles
sklearn.datasets.make_gaussian_quantiles クラスを使用します。
引数
| 引数 | 内容 |
|---|---|
| n_features | 特徴量の数 |
| n_classes | 中心の個数(塊数) |
データセット生成
特徴量の数を 2、塊数を2 に設定してデータセットを生成します。
from sklearn.datasets import make_gaussian_quantiles
X, Y = make_gaussian_quantiles(random_state=0,
n_features=2,
n_classes=2)
print("X =", X[:3])
print("Y =", Y[:20])
plt.figure(figsize=(8, 7))
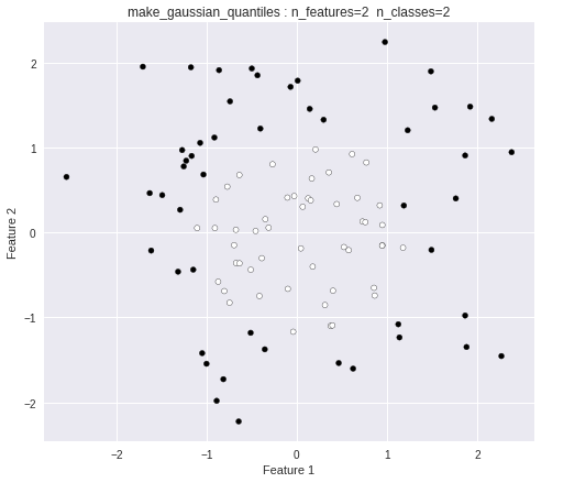
plt.title("make_gaussian_quantiles : n_features=2 n_classes=2")
plt.scatter(X[:, 0], X[:, 1], marker='o', c=Y, s=25, edgecolor='k')
plt.xlabel("Feature 1")
plt.ylabel("Feature 2")
以下のようなデータが出力されます。
X = [[-0.09845252 -0.66347829]
 [ 1.8831507  -1.34775906]
 [-0.90729836  0.0519454 ]]
Y = [0 1 0 1 1 0 0 1 0 0 1 0 1 1 1 0 1 1 1 1]
線形分離不可能なデータが出力されました。
以上、 scikit-learn の データセット生成を試してみました。