はじめに
道路を方角ごとに塗り分けると、その街のでき方がわかる :: デイリーポータルZ という素敵な記事があります。
これを Leaflet と 地理院地図 Vector を使って実装してみましょう。
できあがり
このように動作するものができあがりました。日本全国閲覧可能です。道路の密度が高い地域は表示が重くなるのでご注意を。
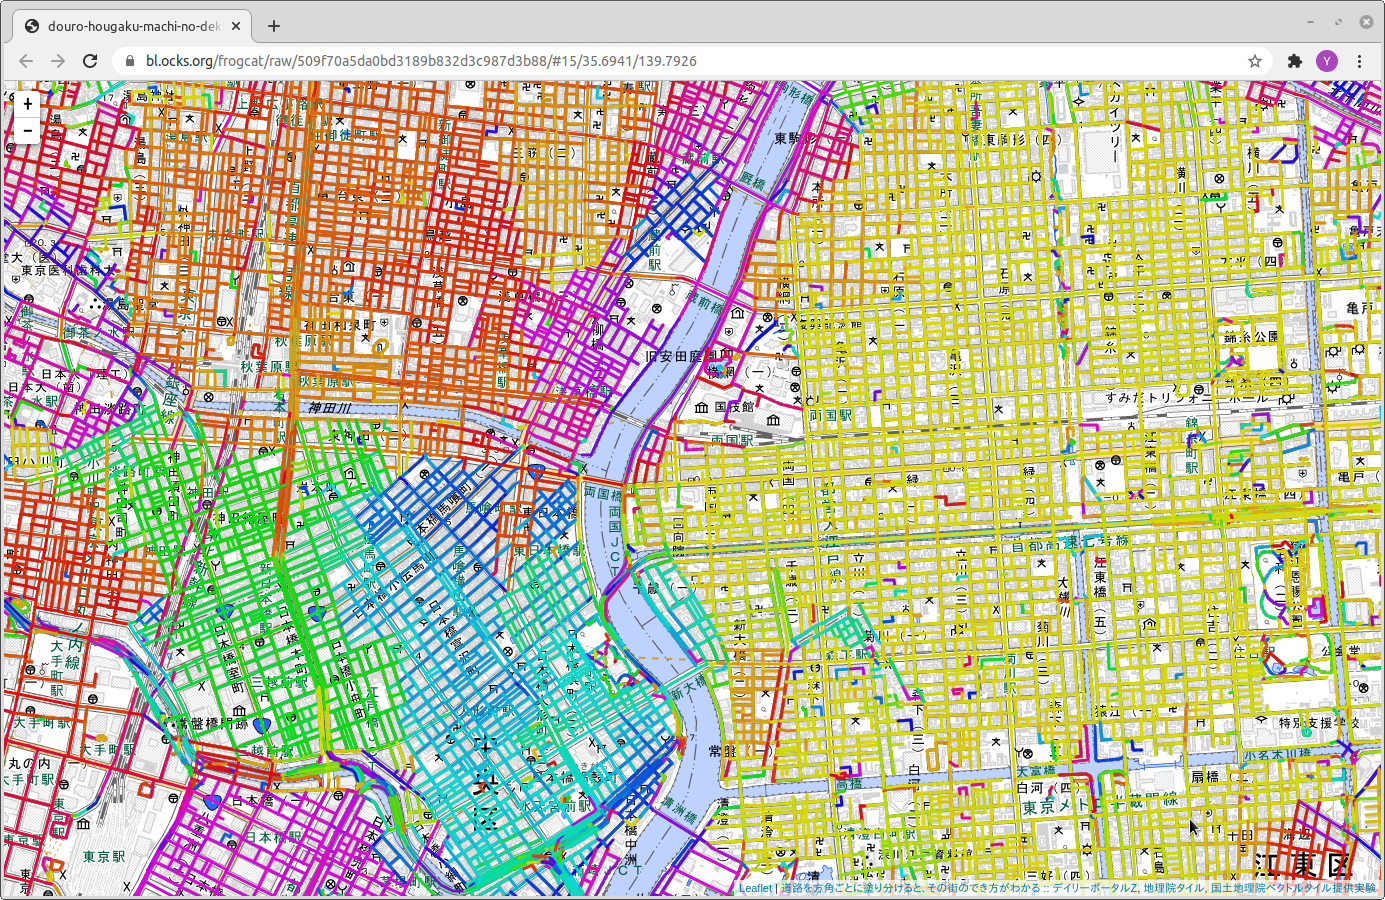
ワーキングデモは上の画像をクリックするか、こちらの URL からどうぞ。
ソースコードは gist においています。LICENSE は MIT を設定しているので適宜ご利用ください。
解説
100行に満たない html/js なのでとりあえず全部貼っておきますね。
<!DOCTYPE html>
<html>

<head>
  <meta charset="UTF-8">
  <title>douro-hougaku-machi-no-dekikata</title>
  <meta name="viewport" content="initial-scale=1.0, maximum-scale=1.0" />
  <link rel="stylesheet" href="https://unpkg.com/leaflet@1.6.0/dist/leaflet.css" />
  <script src='https://unpkg.com/@turf/turf/turf.min.js'></script>
  <script src="https://unpkg.com/leaflet@1.6.0/dist/leaflet.js"></script>
  <script src="https://unpkg.com/leaflet.vectorgrid@1.3.0/dist/Leaflet.VectorGrid.bundled.min.js"></script>
  <script src="https://unpkg.com/leaflet-hash@0.2.1/leaflet-hash.js"></script>
</head>

<body>
  <div id="map" style="position:absolute;top:0;left:0;bottom:0;right:0;"></div>
  <script>
    const map = L.map("map", {
      maxZoom: 19,
      zoom: 15,
      center: [35.6941, 139.792615],
      preferCanvas: true
    });

    map.attributionControl.addAttribution("<a href='https://dailyportalz.jp/kiji/douro-hougaku-machi-no-dekikata'>道路を方角ごとに塗り分けると、その街のでき方がわかる :: デイリーポータルZ</a>");

    L.tileLayer('https://maps.gsi.go.jp/xyz/pale/{z}/{x}/{y}.png', {
      attribution: "<a href='https://maps.gsi.go.jp/development/ichiran.html' target='_blank'>地理院タイル</a>"
    }).addTo(map);

    L.hash(map);

    Object.assign(new L.GridLayer({
      attribution: "<a href='https://github.com/gsi-cyberjapan/gsimaps-vector-experiment' target='_blank'>国土地理院ベクトルタイル提供実験</a>",
      minZoom: 4,
      maxZoom: 16
    }), {
      createTile: function(coords) {
        const template = "https://cyberjapandata.gsi.go.jp/xyz/experimental_bvmap/{z}/{x}/{y}.pbf";
        const div = document.createElement('div');
        div.group = L.layerGroup();
        fetch(L.Util.template(template, coords)).then(a => a.arrayBuffer()).then(buffer => {
          const road = new VectorTile(new Pbf(buffer)).layers.road;
          if (!road) return;
          if (!div.group) return;
          if (!this._map) return;
          for (let i = 0; i < road.length; i++) {
            const geojson = road.feature(i).toGeoJSON(coords.x, coords.y, coords.z);
            const lines = geojson.geometry.type === "LineString" ? [geojson.geometry.coordinates] : geojson.geometry.coordinates;
            lines.forEach(line => {
              const head = line[0];
              const tail = line[line.length - 1];
              let bearing = turf.bearing(head, tail);
              if (bearing < 0) bearing += 180;
              if (bearing > 90) bearing -= 90;
              div.group.addLayer(L.polyline(line.map(a => [a[1], a[0]]), {
                color: `hsl(${45 - bearing*4},90%,45%)`
              }));
            });
          }
          div.group.addTo(this._map);
        });
        return div;
      }
    }).on("tileunload", function(e) {
      if (e.tile.group) {
        if (this._map) this._map.removeLayer(e.tile.group);
        delete e.tile.group;
      }
    }).addTo(map);
  </script>
</body>

</html>
今回のケースでは道路のポリライン座標から道路に着色する色をどう計算するか、というのがほぼ唯一の課題です。
「地理院地図Vector (z=4〜16) を mapbox-gl-js で表示」というのは性能面では良さそうなのですが、「ポリラインの始点と終点のなす線分の角度を計算するための mapbox-gl-js のビルトイン関数」みたいな都合のいい関数がない限り、色を計算するのが無理そうです。
また「地理院ベクトルタイル(道路中心線,z=16)を Leaflet で表示」は技術的にはうまくいくのですが、タイルの整備されている z=16 のズームレベル前後でしか表示できないので、自治体全体を俯瞰するような使い方では厳しそうです。
今回は 「地理院地図Vector(z=4〜16) を Leafletで表示」の方針でやってみました。この手法自体は拙稿 Leaflet でバイナリベクトルタイル処理の流れを追ってみる の焼き直しです。あとは角度計算のために turf.bearing を導入した程度です。
まとめ
とりあえず日本全国をカバーして動くもの、ということで Leaflet と 地理院地図Vector で実装してみました。
道路幅や道路種別は無視しているので、そのあたりをもう少し改善するとよりそれっぽくなるかもしれません。
また、地理院地図Vector のかわりに https://docs.mapbox.com/vector-tiles/reference/mapbox-streets-v8/ などの OpenStreetMap 由来のベクトルタイルを使えば全世界版も比較的簡単に作れるかもしれません。