地理院タイル の 地理院タイル目録 を入力として当該タイルのカバーする領域がわかるような GeoJSON を生成する手順を紹介します。なお、このポストはラスタ/ベクタ変換ツールである potrace の GeoJSON 出力の紹介も兼ねています。
1. シナリオ
東日本大震災被災地震災直後オルソ画像(2011年3月~2011年4月撮影) のタイルが提供されている領域を GeoJSON ファイルとして出力しましょう。なお、同タイルの目録は以下の URL から入手できます。
2. 手順
potrace と nodejs をインストールしておきましょう
$ sudo apt-get install potrace
$ sudo apt-get install nodejs
適当な作業ディレクトリを作成して、mokuroku.csv.gz を展開しておきます
$ mkdir work
$ cd work
$ curl http://cyberjapandata.gsi.go.jp/xyz/toho1/mokuroku.csv.gz | zcat > mokuroku.csv
作業ディレクトリに以下の mokuroku2geojson.js を作成します
"use strict";

const fs = require("fs");
const execSync = require("child_process").execSync;
const input = process.argv[2];

function xy2ll(x, y, z) {
  var n = Math.PI - 2 * Math.PI * y / Math.pow(2, z);
  return [
    x / Math.pow(2, z) * 360 - 180,
    180 / Math.PI * Math.atan(0.5 * (Math.exp(n) - Math.exp(-n)))
  ];
}

function Bounds() {
  this.min = null;
  this.max = null;
  this.points = {};
}
Bounds.prototype.add = function(point) {
  this.min = this.min ? [
    Math.min(this.min[0], point[0]),
    Math.min(this.min[1], point[1])
  ] : point;
  this.max = this.max ? [
    Math.max(this.max[0], point[0]),
    Math.max(this.max[1], point[1])
  ] : point;
  this.points[point.join("/")] = true;
};
Bounds.prototype.toPBM = function() {
  var a = "P1\n";
  a += (this.max[0] - this.min[0] + 1) + " ";
  a += (this.max[1] - this.min[1] + 1) + "\n";
  for (var y = this.min[1]; y <= this.max[1]; y++)
    for (var x = this.min[0]; x <= this.max[0]; x++) {
      a += this.points[x + "/" + y] ? "1" : "0";
      a += (x == this.max[0] ? "\n" : " ");
    }
  return a;
};

function flash(zoom, data) {

  var pbm = input.replace(/\.[^\.]+$/, "." + zoom + ".pbm");
  var json = input.replace(/\.[^\.]+$/, "." + zoom + ".json");
  var geojson = input.replace(/\.[^\.]+$/, "." + zoom + ".geojson");

  var bounds = new Bounds();
  data.forEach(a => {
    bounds.add([a[1], a[2]]);
  });

  fs.writeFileSync(pbm, bounds.toPBM(), "UTF-8");
  execSync("potrace -b geojson " + pbm + " -o " + json);

  var dig = function(a) {
    if (a.forEach && !a[0].forEach) {
      var b = xy2ll(bounds.min[0] + a[0] + 0.5, bounds.max[1] - a[1] + 0.5, zoom);
      a[0] = Math.round(b[0] * 10e6) / 10e6;
      a[1] = Math.round(b[1] * 10e6) / 10e6;
    } else if (a.geometry && a.geometry.coordinates)
      a.geometry.coordinates.forEach(dig);
    else if (a.forEach)
      a.forEach(dig);
    else if (a.features)
      a.features.forEach(dig);
    return a;
  };

  var j = dig(JSON.parse(fs.readFileSync(json, "UTF-8")));
  fs.writeFileSync(geojson, JSON.stringify(j, null, ""), "UTF-8");
}

(function() {
  var zoom = NaN;
  var data = [];
  fs.readFileSync(input, "utf-8")
    .split("\n")
    .filter(a => a.match(/^[0-9]+\/.+$/))
    .filter(a => !a.endsWith("41ad1e3d34ec92311b20acb1a37ccef7"))
    .forEach(a => {
      var b = a.split(/[,\.\/]/);
      if (data.length == 0 || b[0] == zoom) {
        data.push(b);
      } else {
        flash(zoom, data);
        data = [];
      }
      zoom = b[0];
    });
  if (data.length > 0)
    flash(zoom, data);
})();
実行します。第一引数に mokuroku.csv のパスを指定します。
$ node mokuroku2geojson.js mokuroku.csv
うまくいくと以下のように各種ファイルが生成されます
$ ls -1
mokuroku.15.geojson
mokuroku.15.json
mokuroku.15.pbm
mokuroku.16.geojson
mokuroku.16.json
mokuroku.16.pbm
mokuroku.17.geojson
mokuroku.17.json
mokuroku.17.pbm
mokuroku.csv
mokuroku2geojson.js
$
ズームレベルごとに geojson ファイルが作成されます。 *.json や *.pbm は中間ファイルなので削除しても差し支えありません。
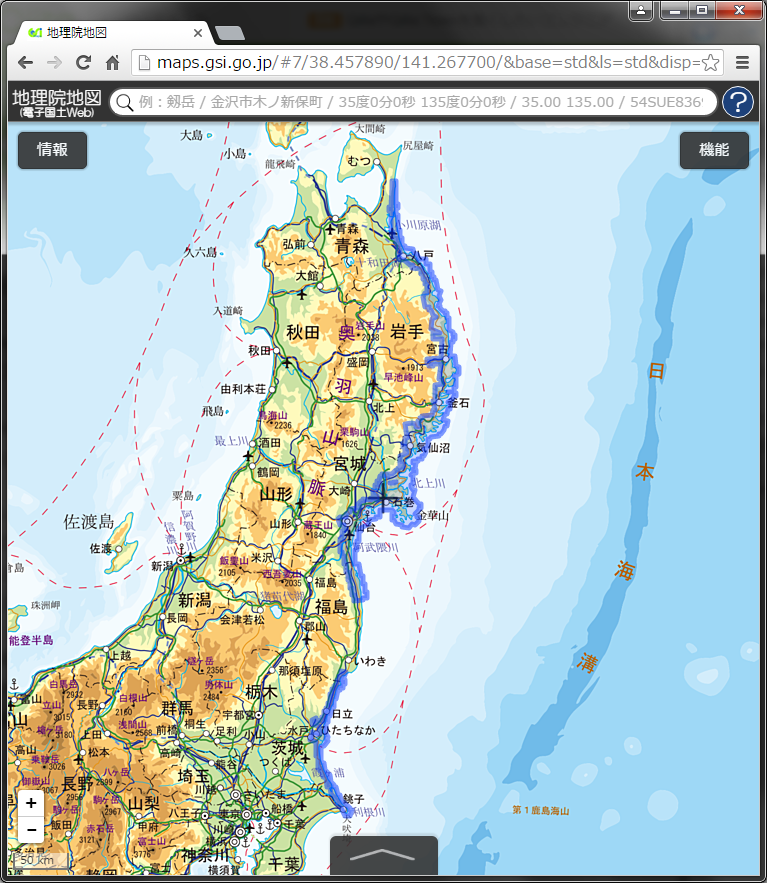
適当な geojson を 地理院地図 にドラッグ&ドロップすると、geojson の領域が表示されます。以下の例は mokuroku.17.geojson をドロップした例です。
Gist はこちら。
https://gist.github.com/frogcat/2f10d55ff7115c7b5ca743073d195a0f
3. 解説
potrace
potrace はビットマップファイルを入力として滑らかなベクトルデータを作成するツールです。2001年に登場した歴史のあるソフトウェアなのですが、2013年から GeoJSON の出力に対応したとのことです。通常はベジエ曲線の使える SVG や EPS などを使用することが多いのですが、出力先を GeoJSON にすることで FeatureCollection > Polygon+ の形式で出力が得られます。
入力ファイルは BMP か PNM に対応しているのですが、タイルの有無だけを考えるのであれば PNM の二値形式である PBM がシンプルです。
前処理によって pbm を用意した上で、以下のようなコマンドで GeoJSON 出力が得られます。
$ potrace -b geojson input.pbm -o output.json
しかし、出力の GeoJSON はラスタ画像の座標系に従っているので、後処理として座標変換を行う必要があります。
前処理
mokuroku.csv を読み込んで、PBM ファイルを作成する処理です。難しい処理はないので、ソースを追っていただければ。なお、入力が透明な PNG だった場合には「タイルなし」と判定するような細工をしています。
中間処理
node.js から potrace を実行するために execSync を使っています
後処理
各座標について、pbm の座標をタイルの xy(z) 座標に戻した上で、さらに xy(z) 座標から緯度経度座標に戻すような処理を行っています。xy(z) 座標から緯度経度座標への変換は xy2ll 関数でやっています。詳しくは以下をどうぞ。
4. まとめ
- potrace を使ってタイルの領域を GeoJSON として出力する基本的な手順を紹介しました
- potrace の詳細なオプションを設定することで良好な出力が得られるかも
- 巨大な mokuroku が処理できるかは不明です。やってみた方がいたらコメントください。