Unity Profiler で、実行時間やメモリ量を確認する。
書き方
Profiler.BeginSample()とProfiler.EndSample()でサンドイッチする。
例えば↓↓こんな感じ。
Hoge()を実行しないと何も起こらない!注意。
using UnityEngine.Profiling;

... 省略

// どこかで実行してね
private void Hoge()
{
    Profiler.BeginSample("好きな名前");

    // ここに書いた処理が、計測される

    Profiler.EndSample();
}
プロファイル結果を確認する
- Unity Profiler を開く。Ctrl + 7 のショートカットもある。
- 該当フレームにバーを持ってくる。
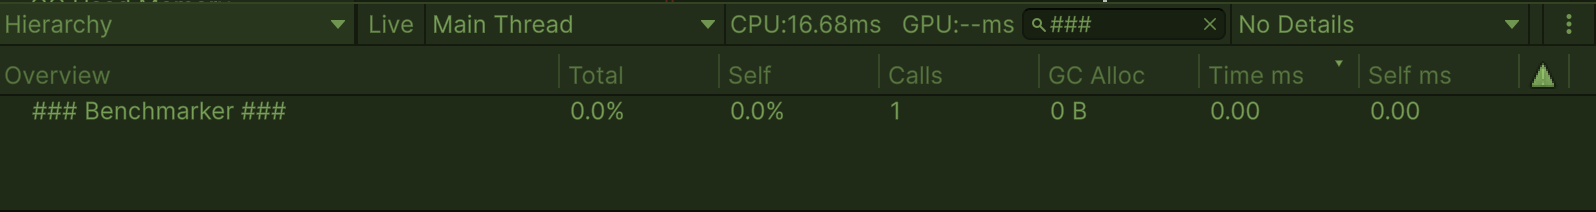
- 検索欄に、さっきの「好きな名前」を入れて検索しよう!
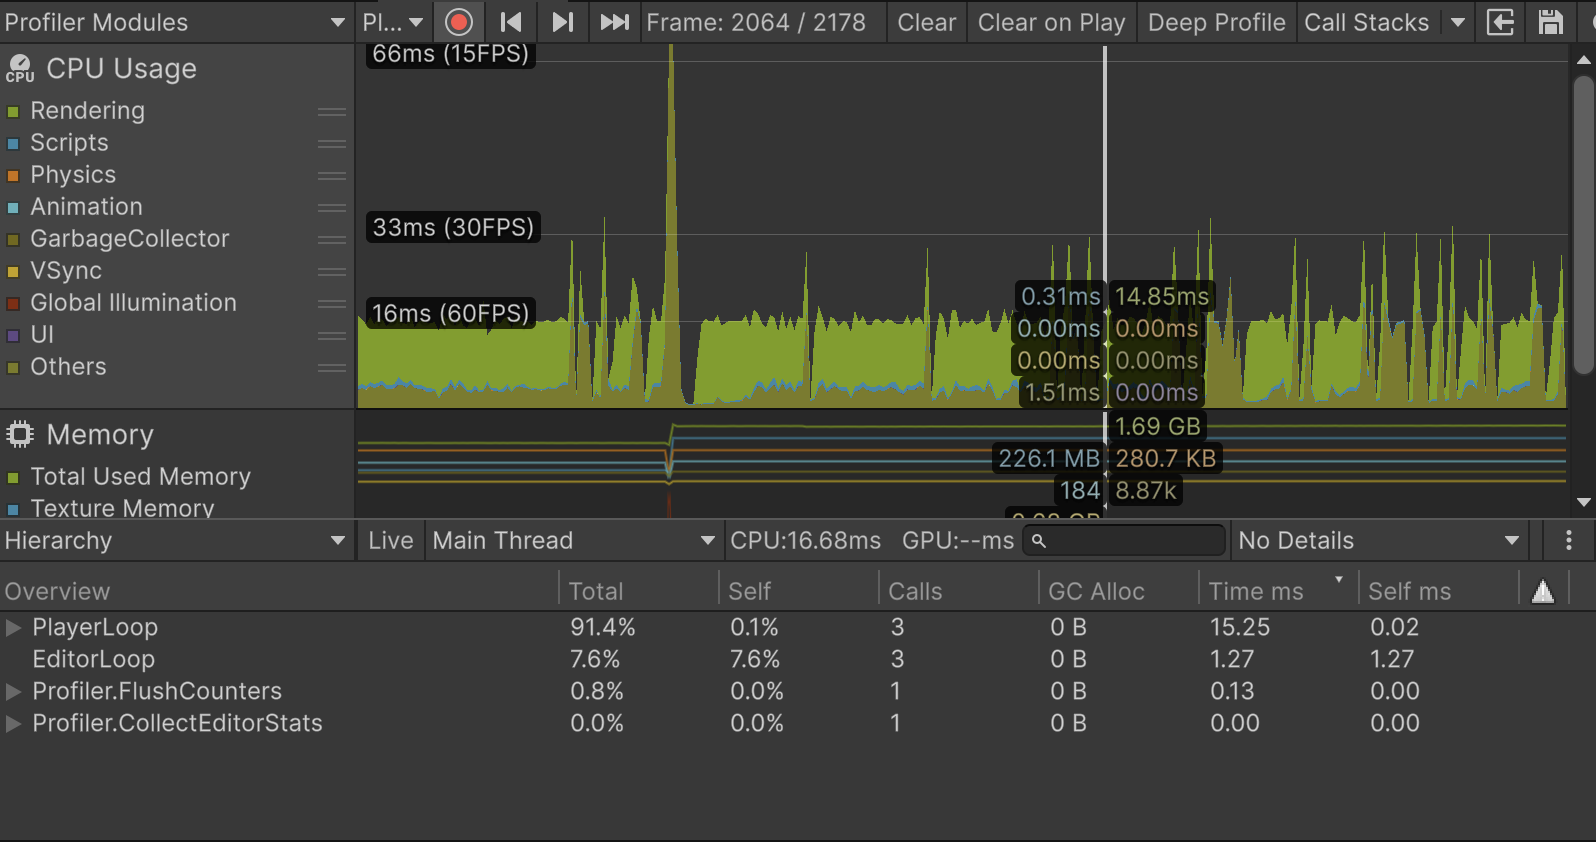
見るべき数値
GC Alloc
ヒープアロケーションの値。なるべく小さい方が良い。
Time ms / Self ms
処理の実行時間。なるべく小さい方が良い。
計測のコツ
1. たくさん実行する
処理が1回だけだと速攻で終わってしまうので、100万回とか繰り返してその値を見る。
2. 最初にウォームアップを入れるといいかも
計測直前に、数回処理を実行させておく。
クラスの初期化処理があったりすると、最初だけパフォーマンスが悪くなったりするため。
3. 可能ならば実機で検証する
Development Build ならば、実機でのパフォーマンスもプロファイリングできる。
メモリの使われ方とかは、エディタとビルド時で結構違うので、可能ならば本番環境で計測したい。