はじめに
IBM Application Gatewayの統計情報を、statsdサーバーへ送付する機能があります。
今回は、このIBM ApplicationGatewayの統計情報を送信する機能を試してみました。
(参考)マニュアル
Enabling Statistics Gathering、Statistics
また、以下のqiita記事も参考にさせて頂きました。
IBM Cloud Monitoring with Sysdigで、IBM Cloud Kubernetes Service(IKS)の環境をモニタリングしてみる
IBM CloudでStatsDの統計情報を受信できるサービスは?
IBM Cloud のサービスでStatsdを受け取りできるサービスがないか調べたところ、「IBM Cloud Monitoring」というものがあり、StastDサーバーとして統計収集ができそうだったため、早速試してみました。
https://cloud.ibm.com/docs/monitoring?topic=monitoring-kubernetes_cluster
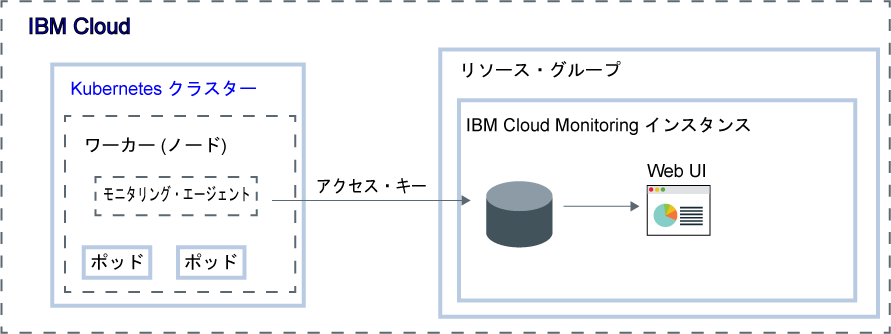
IBM Cloud® Monitoring サービスにメトリックを転送するように IBM Cloud™ Kubernetes Service クラスターを構成する方法を学習できます。
メトリックを転送するようにクラスターを構成するには、DaemonSet を使用して Kubernetes クラスターの各ワーカー・ノードにモニタリング・エージェントをインストールする必要があります。 モニタリング・エージェントでは、IBM Cloud Monitoring インスタンスでの認証のためにアクセス・キー (トークン) を使用します。 モニタリング・エージェントは、データ・コレクターとして機能します。 ワーカー・ノード CPU やワーカー・ノード・メモリーの使用率、コンテナーの入出力 HTTP トラフィック、いくつかのインフラストラクチャー・コンポーネントに関するデータなどのメトリックを自動的に収集します。 さらに、Prometheus 対応スクレイパーまたは StatsD ファサードを使用すれば、エージェントでカスタム・アプリケーション・メトリックを収集することもできます。
1.IBM Cloud Monitoring with sysdig 設定
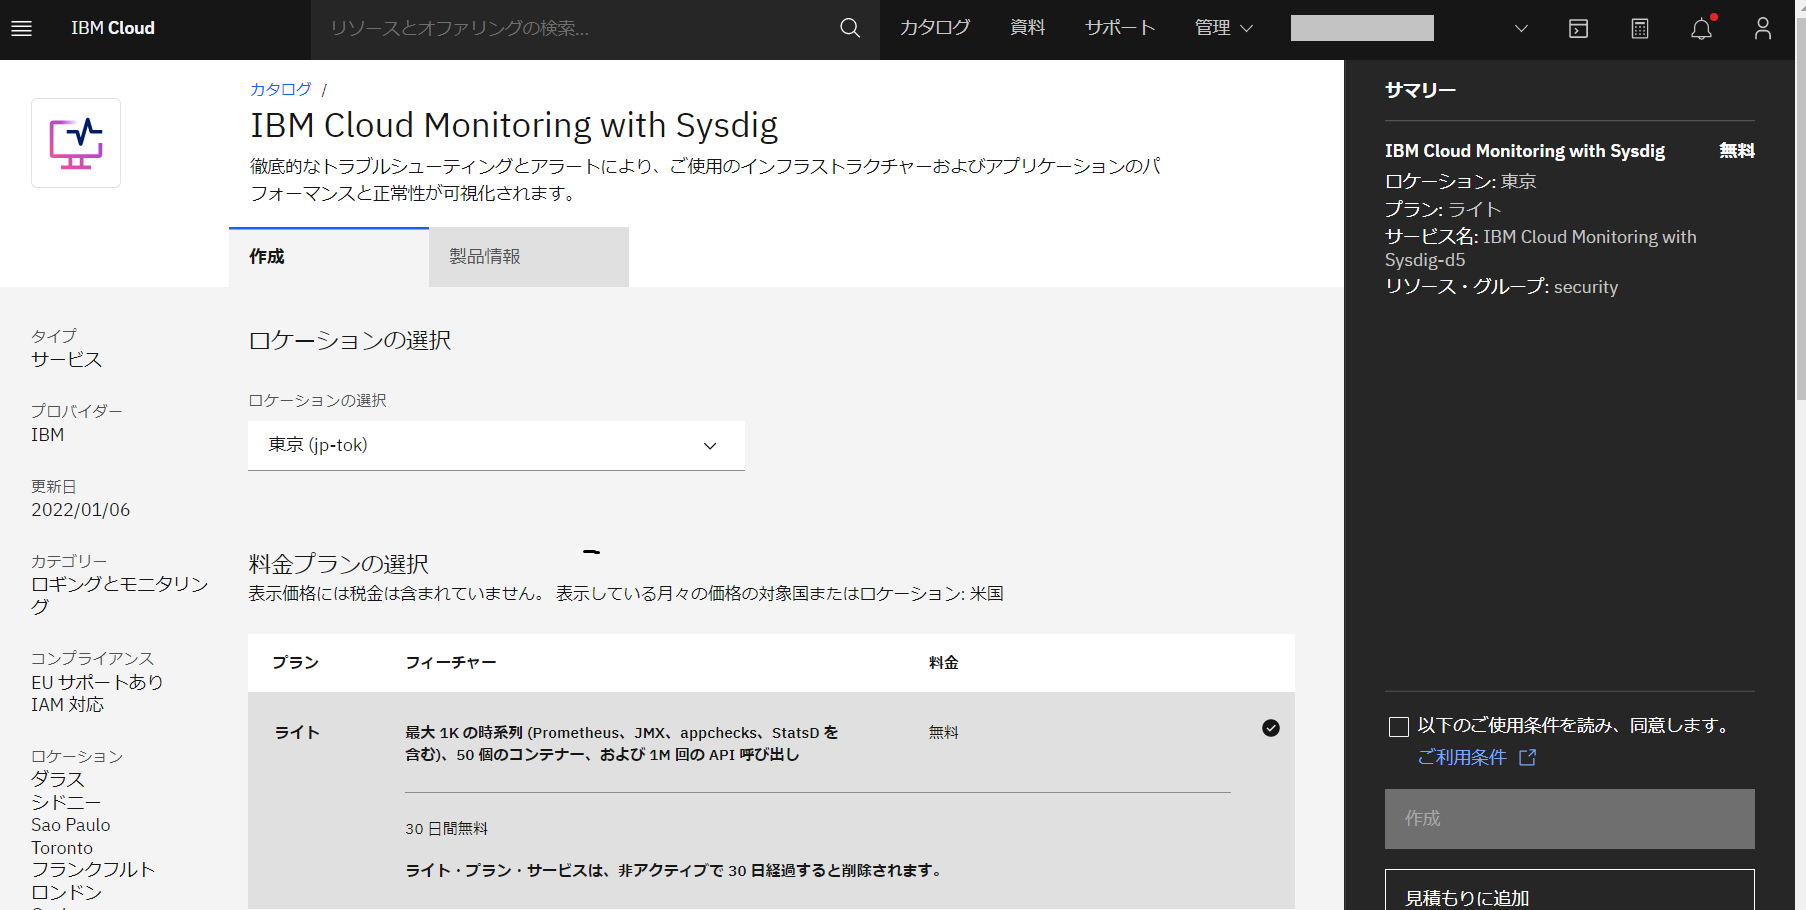
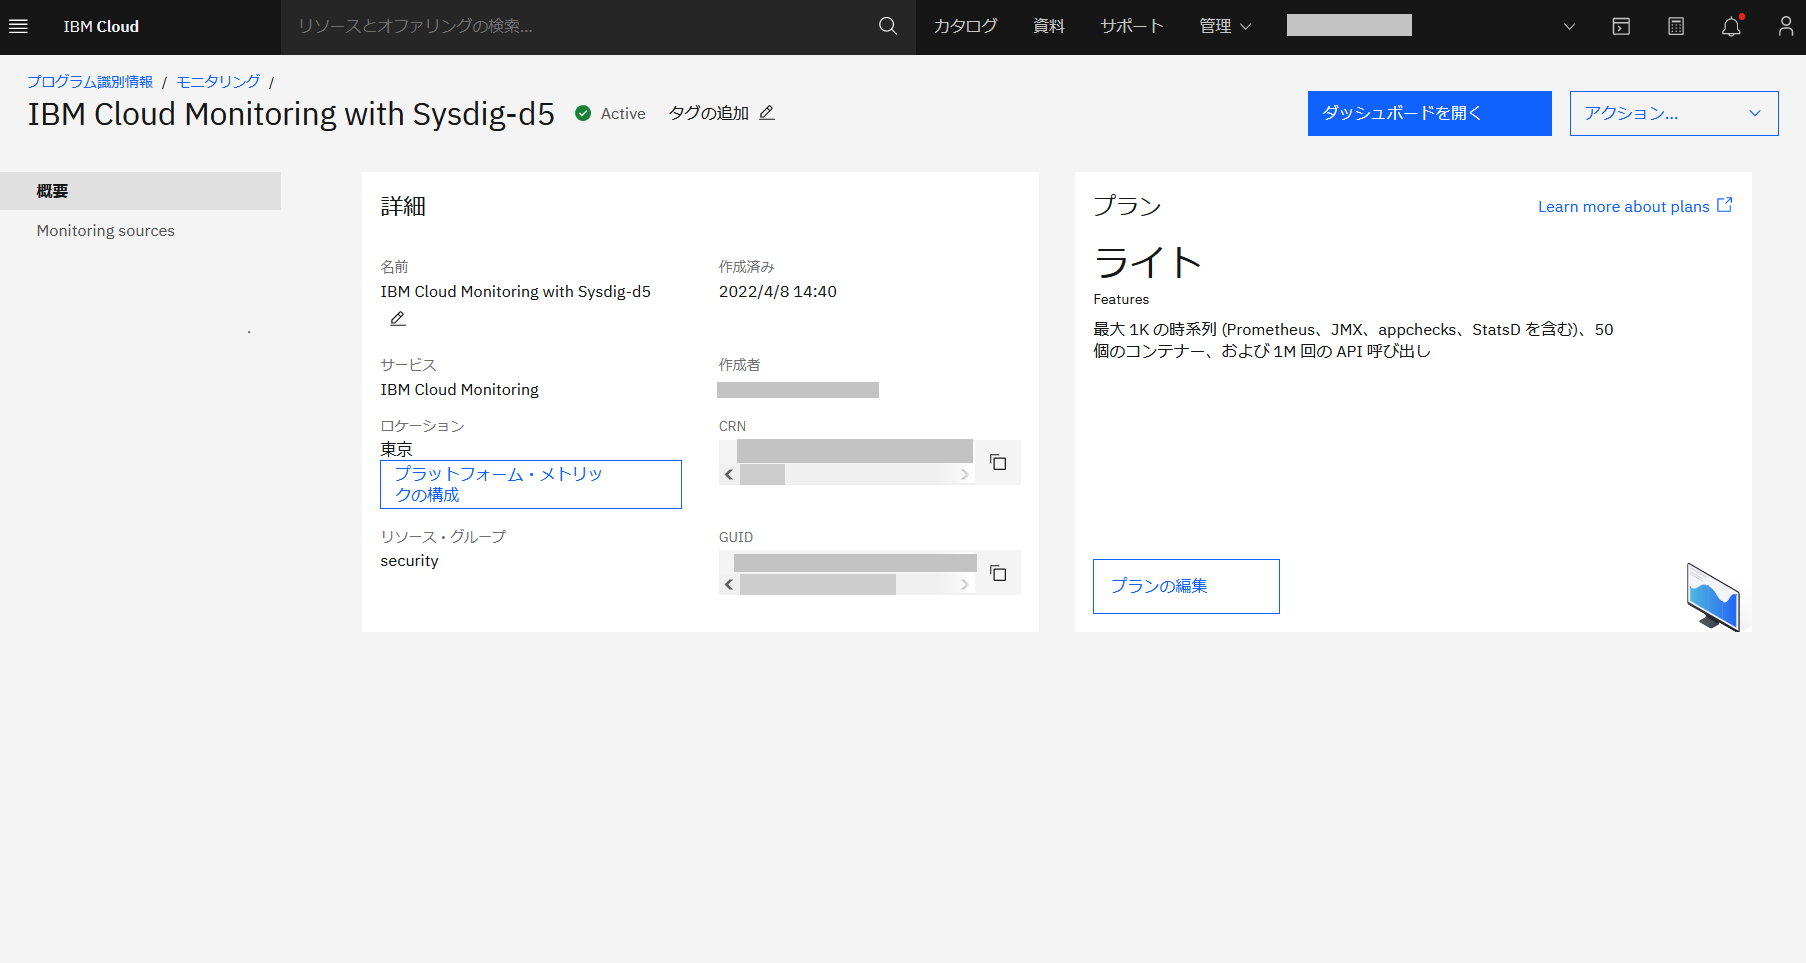
IBM Cloud Monitoring を開きます。
今回は検証のため、無料のライトプランを選択しました。
ライトプランでは、作成時にエラーがでてましたが、機能は使えました。
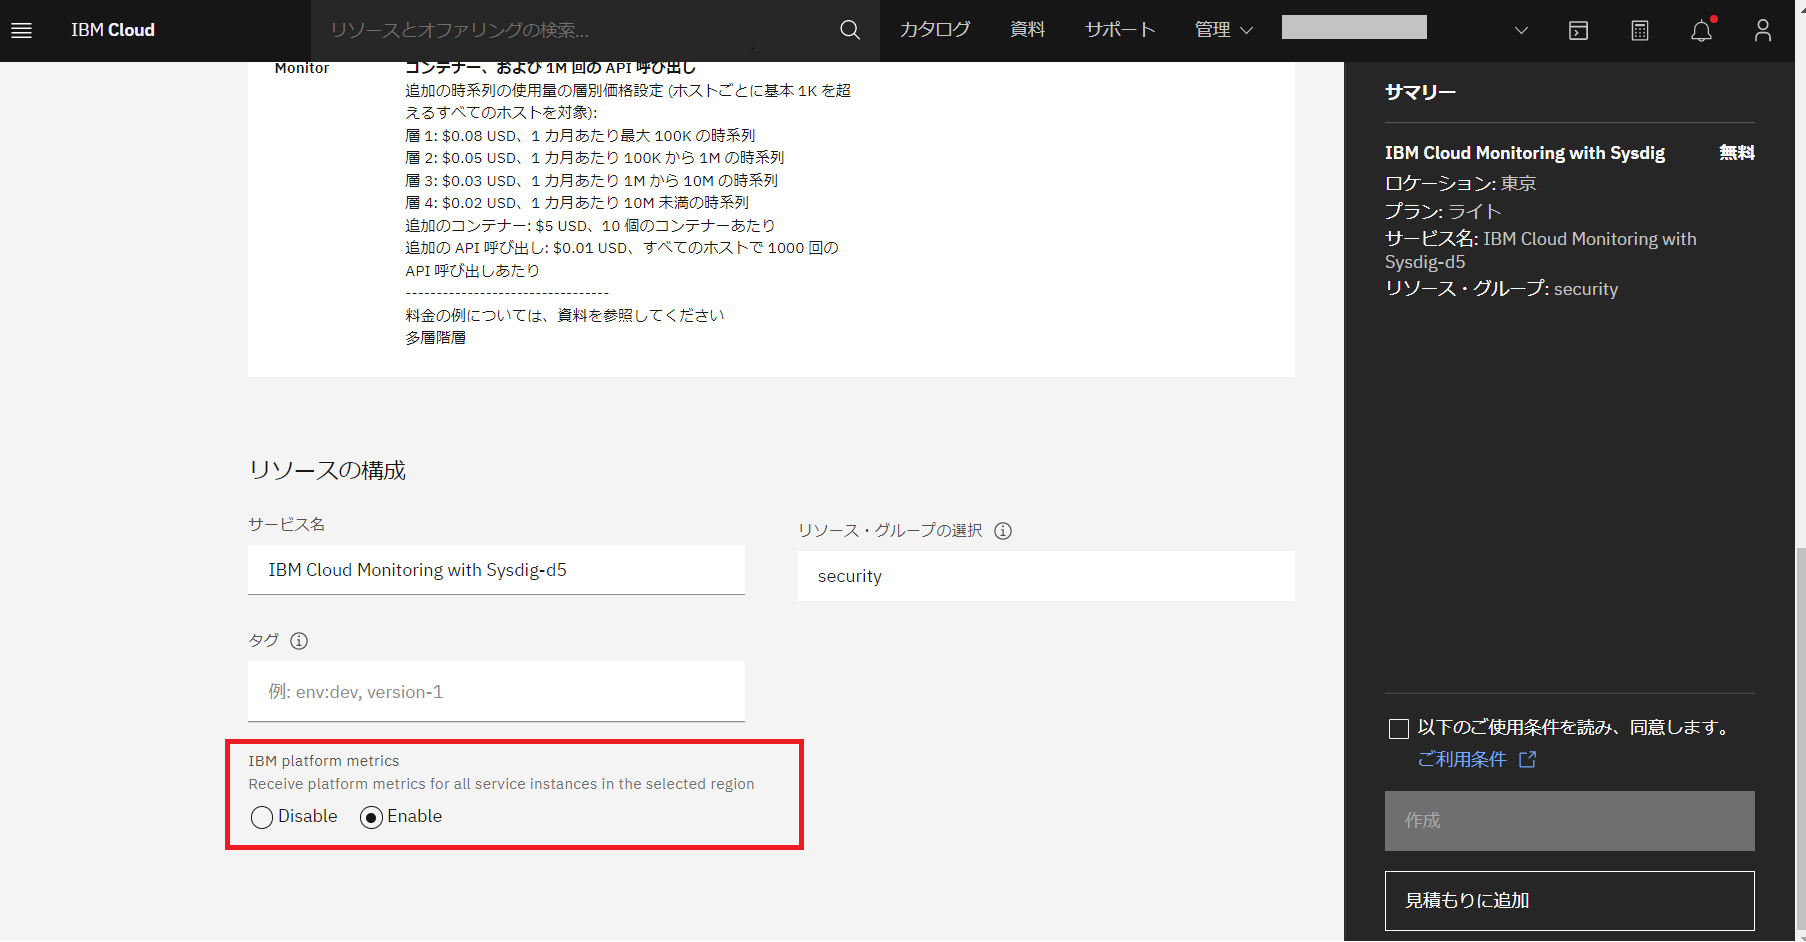
参照していた記事で「IBM Platform Metrics」を有効化とあったため、あわせて有効化しました。
使用条件に同意して、「作成」をクリックします。
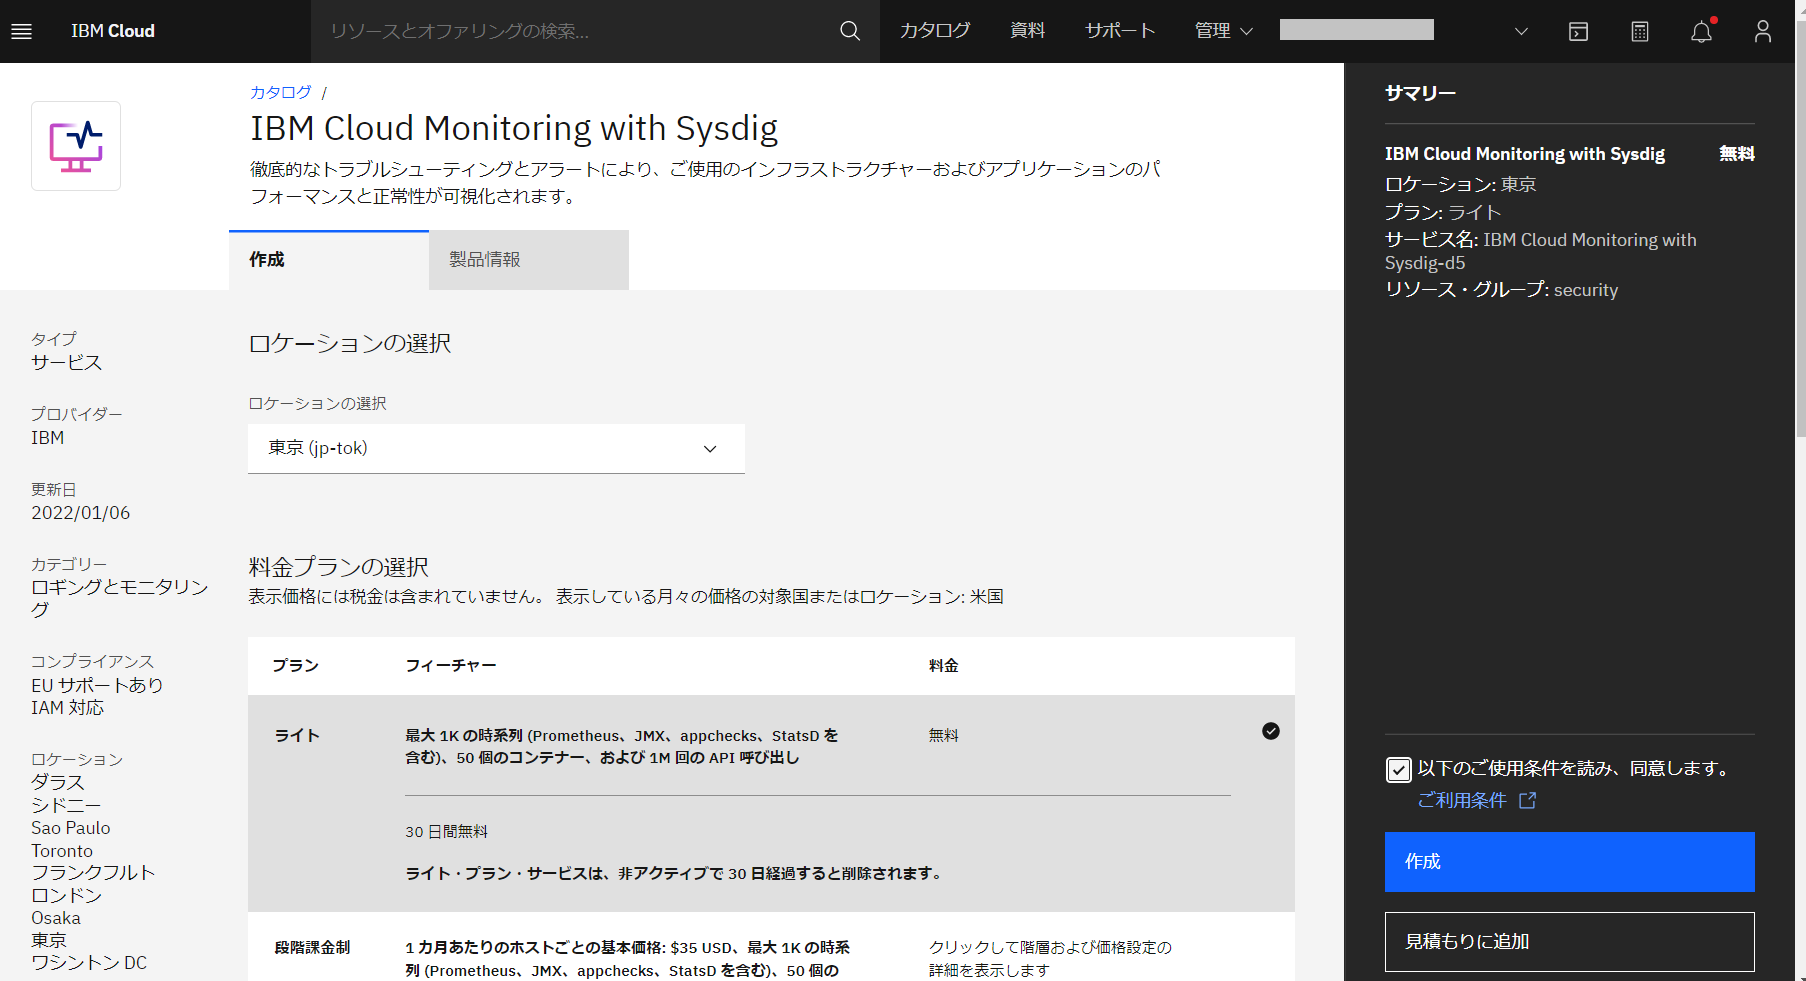
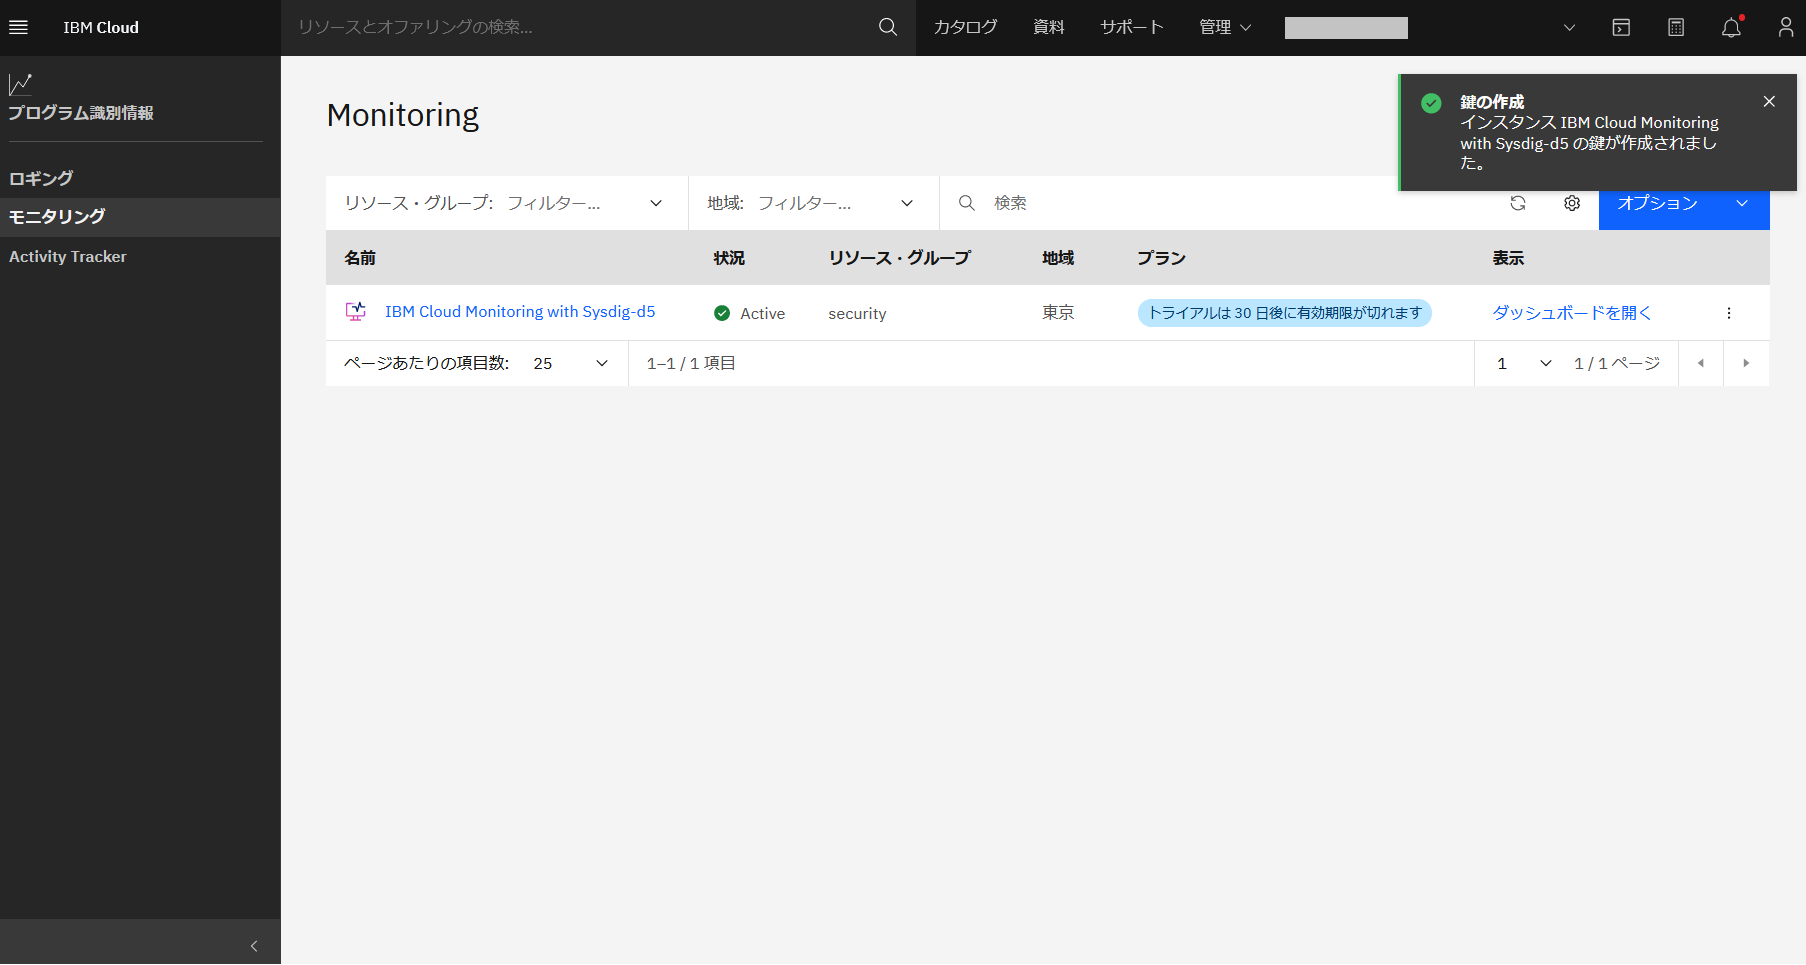
リソースが作成されました。
Openshiftに関するエージェントのインストール手順もあります。
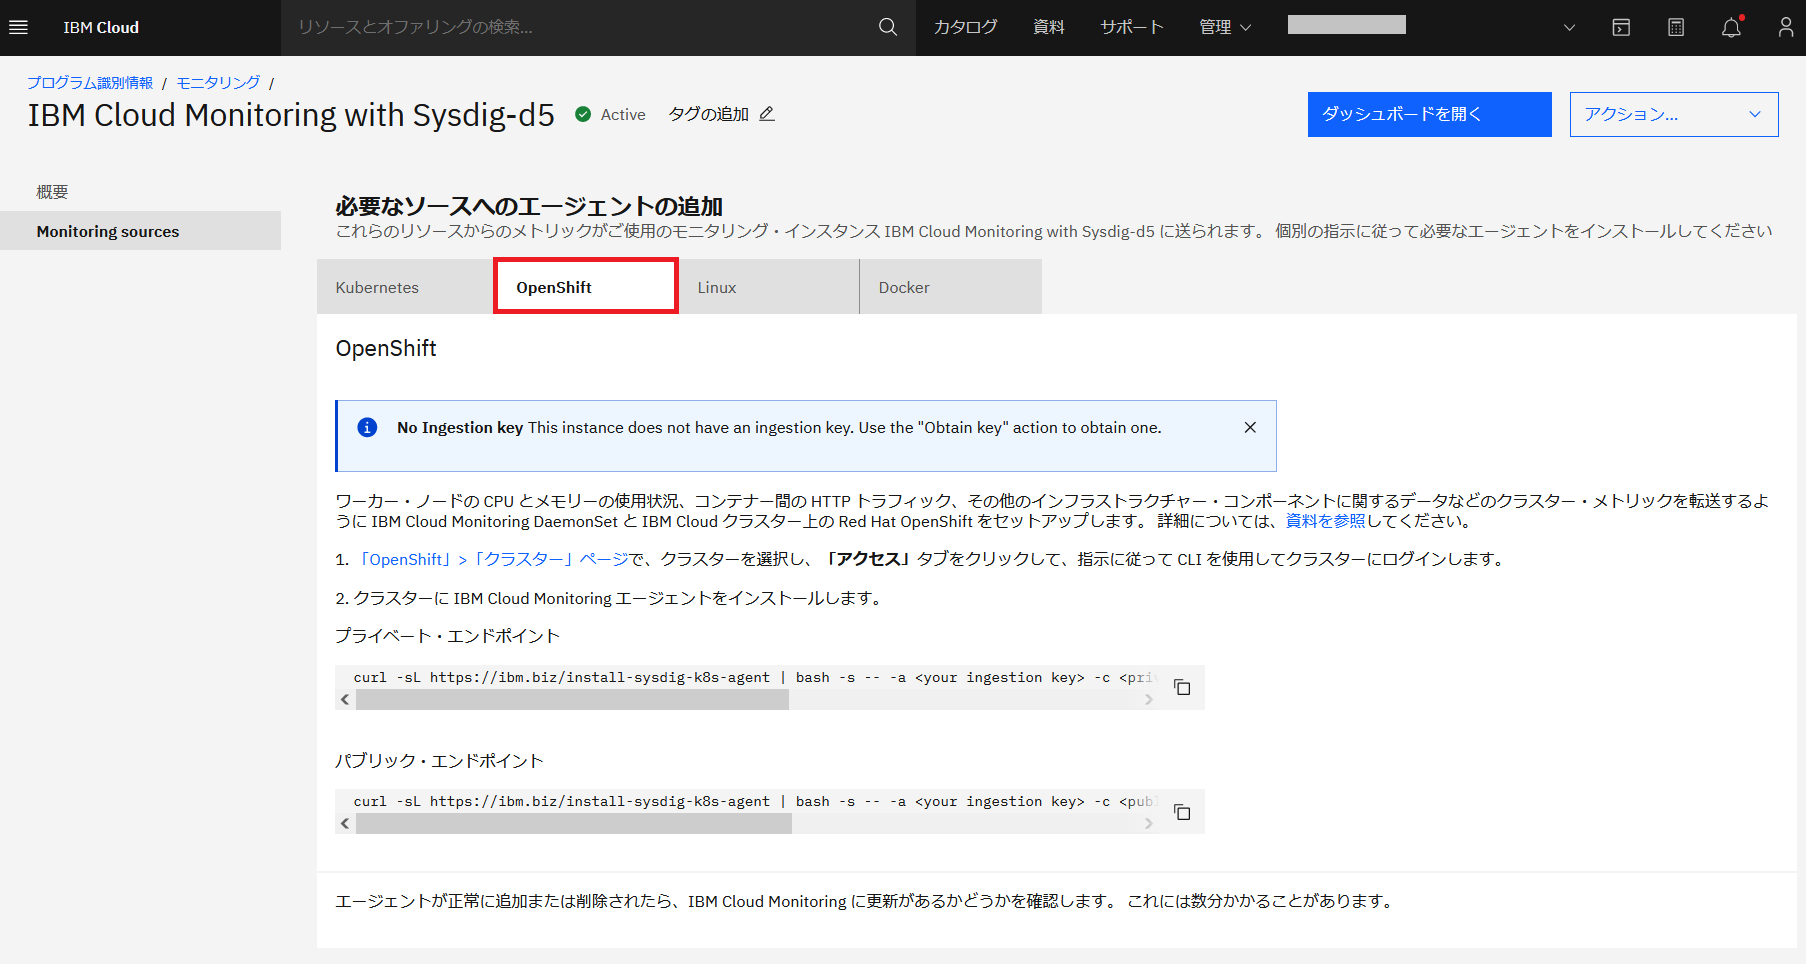
Openshiftにエージェントをデプロイするためには、Ingestion Keyという鍵の発行が必要とありました。
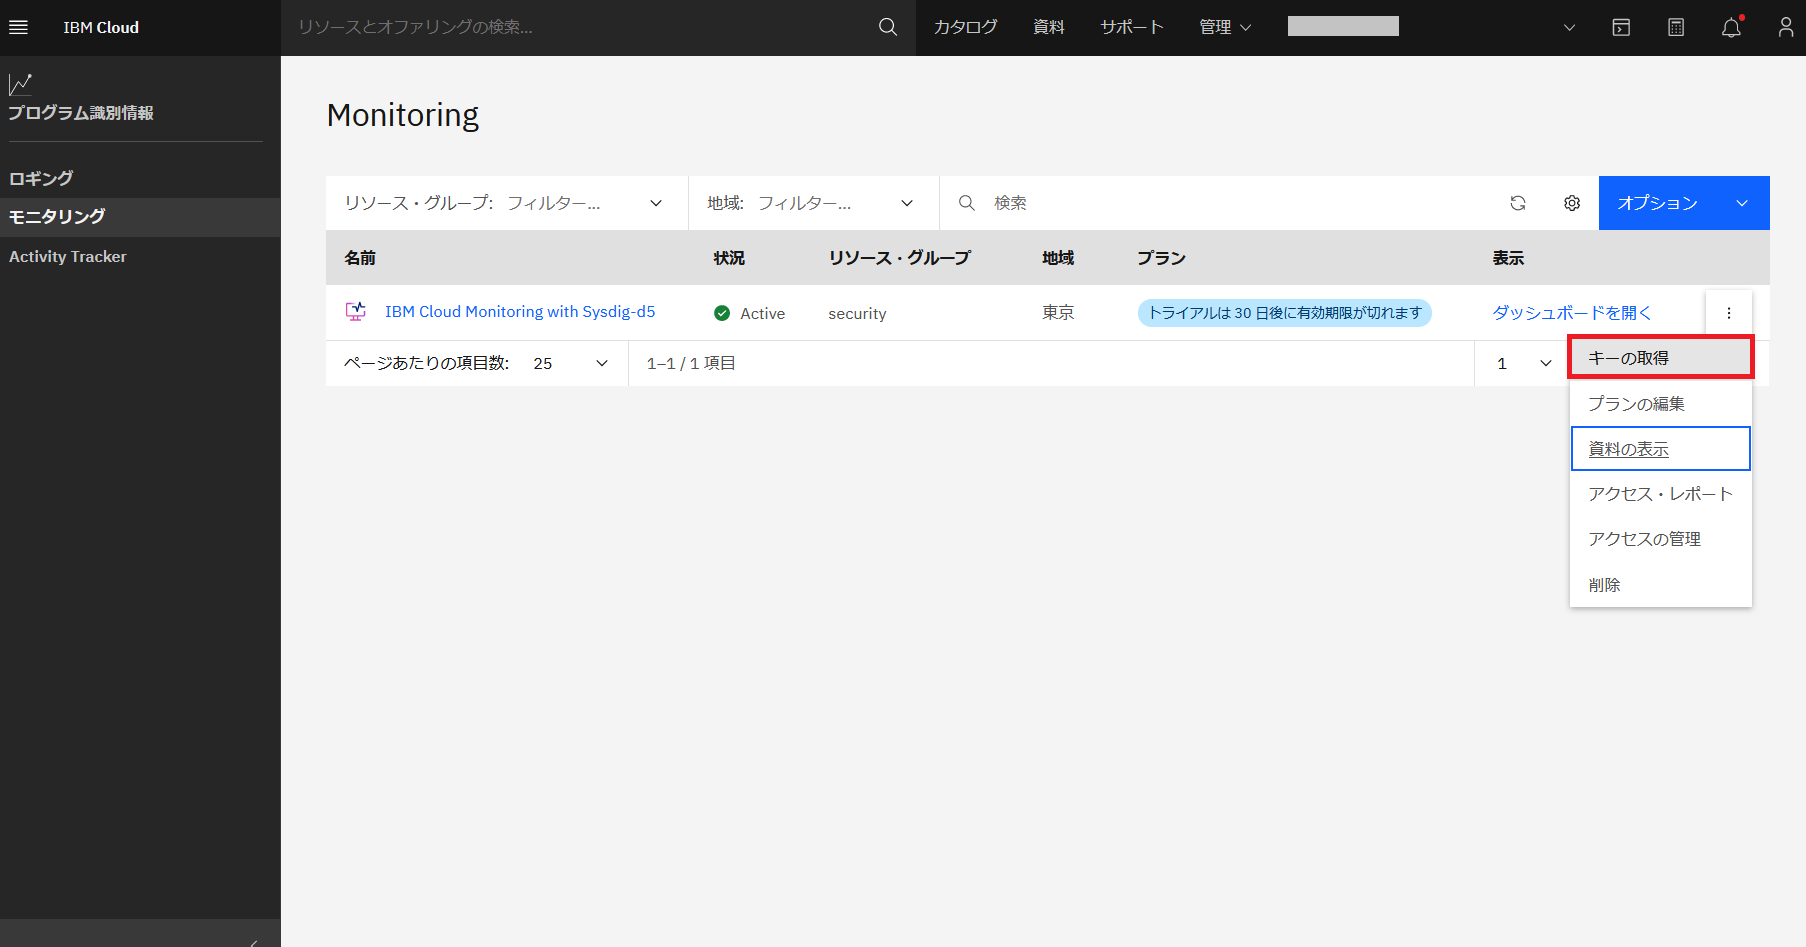
IBM Cloudのメニューから「プログラム識別情報」を開き、作成したリソースのメニューから「キーを取得」を選びます。
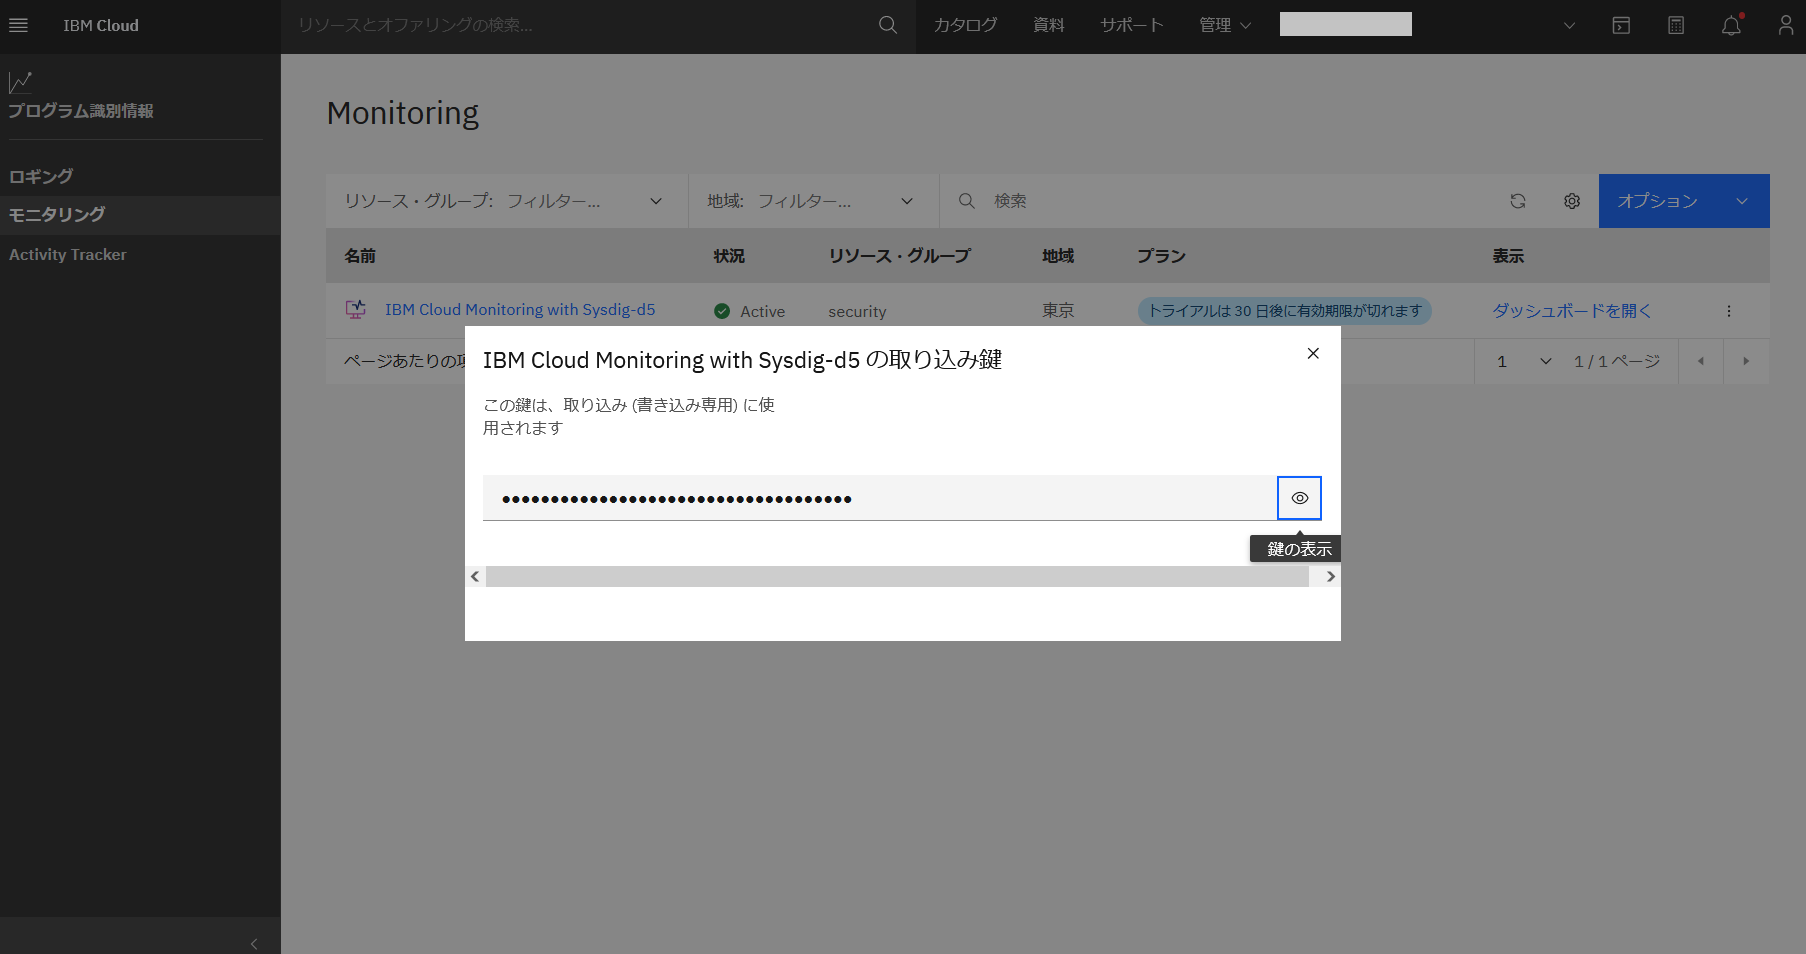
「鍵を取得する」をクリックします。
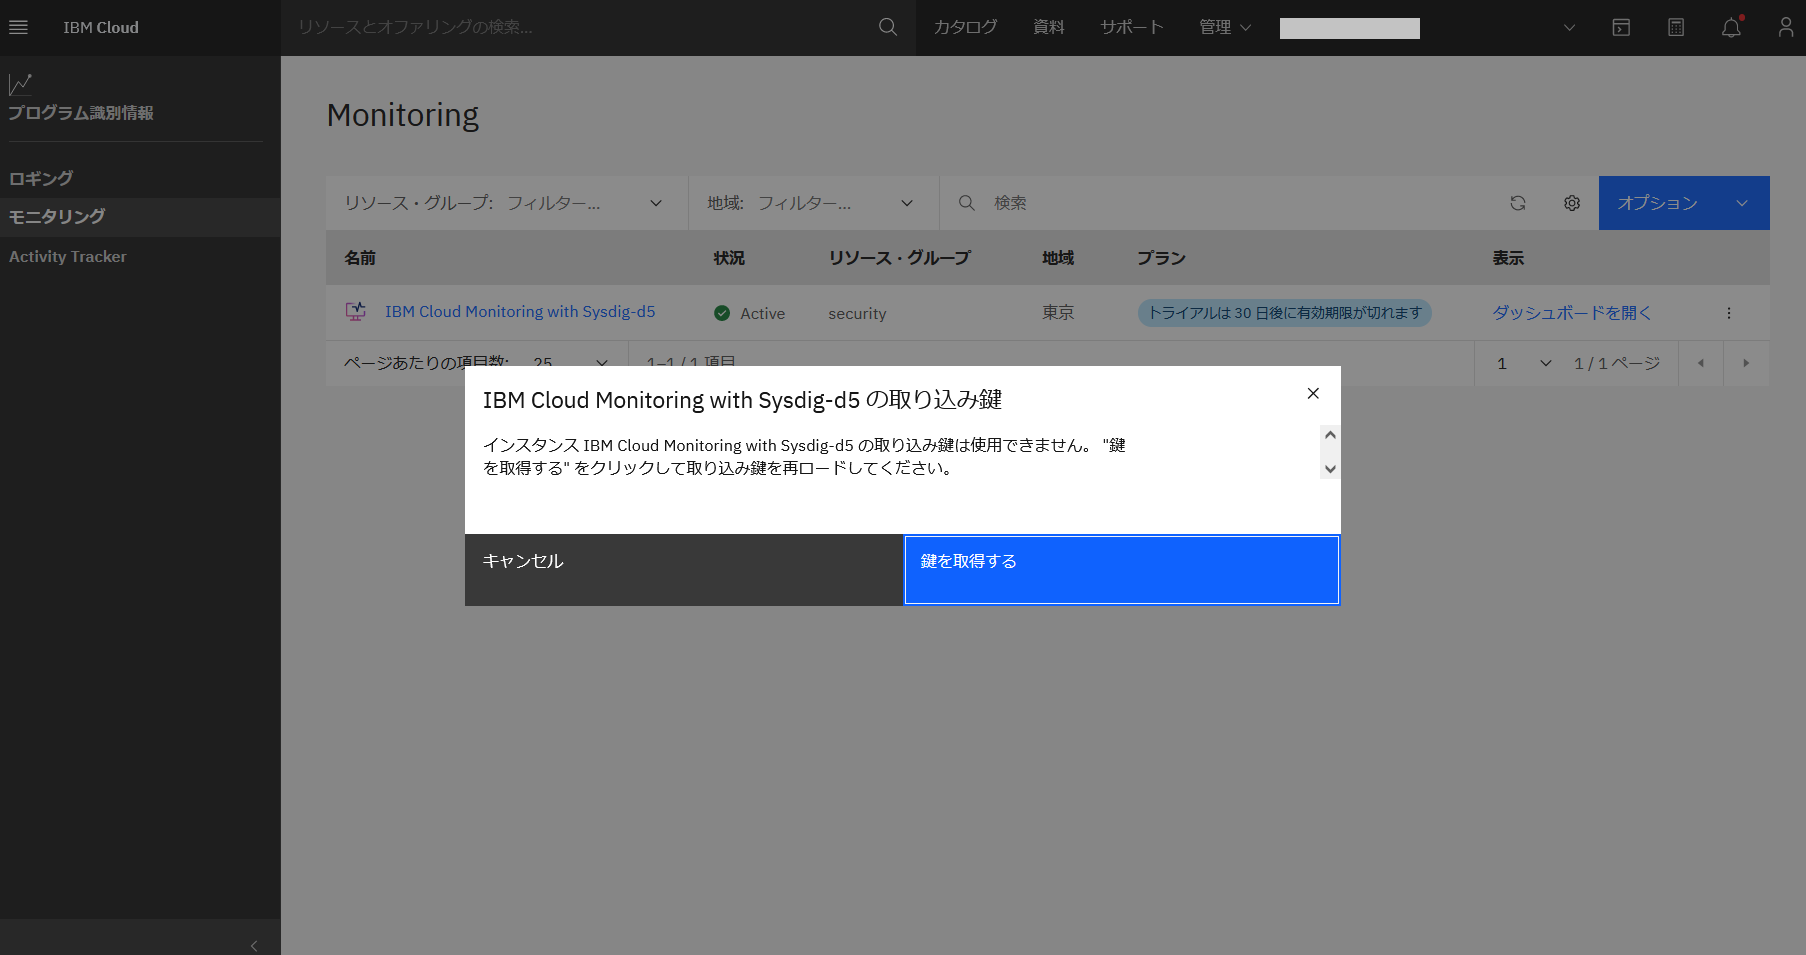
「鍵」が作成されたことを確認します。
Openshift環境用のコマンドをコピーして実行します。
PrivateとPublicの2つがありましたが、Privateのみ実行しました。
詳細は省きますが、WindowsのPowershellやコマンドプロンプトでは実行できなかったためWSL2を用いたUbuntu環境でエージェントのインストールを行いました。
curl -sL https://ibm.biz/install-sysdig-k8s-agent | bash -s -- -a <ingestion key> -c ingest.private.jp-tok.monitoring.cloud.ibm.com -ac 'sysdig_capture_enabled: false' --openshift
Ubuntu環境でも不足しているパッケージがたくさんありましたので都度潰していき、
- kubectlコマンド
- ibmcloud CLIコマンド
- jqコマンド
最終的にはPodのデプロイできました。
> curl -sL https://ibm.biz/install-sysdig-k8s-agent | bash -s -- -a 85xxxxxa7-xxxx-xxxx-xxxx-dxxxxxxxxb9 -c ingest.private.jp-tok.monitoring.cloud.ibm.com -ac 'sysdig_capture_enabled: false' --openshift
* Detecting operating system
* Downloading yamls files to the temp directory: /tmp/sysdig-agent-k8s.vnf3mH
* Downloading Sysdig cluster role yaml
* Downloading Sysdig config map yaml
* Downloading Sysdig daemonset v2 yaml
* Downloading Sysdig daemonset slim v2 yaml
* Downloading Sysdig kmod-thin-agent-slim daemonset
* Creating project: ibm-observe
* Creating sysdig-agent serviceaccount in project: ibm-observe
* Creating sysdig-agent clusterrole
clusterrole.rbac.authorization.k8s.io/sysdig-agent unchanged
* Creating sysdig-agent access policies
* Creating sysdig-agent secret using the ACCESS_KEY provided
* Retrieving the Cluster ID and Cluster Name
FAILED
'ks' is not a registered command. Check your list of installed plug-ins. See 'ibmcloud help'.

* Setting ibm.containers-kubernetes.cluster.id c2xxxxxxxxxxg
* Updating agent configmap and applying to cluster
* Setting tags
* Setting collector endpoint
* Adding additional configuration to dragent.yaml
* Enabling Prometheus
configmap/sysdig-agent created
Slim agent selected
Processing all-icr-io as all-icr-io
secret/all-icr-io created
* Deploying the sysdig agent
daemonset.apps/sysdig-agent created

The list of agent pods deployed in the namespace "ibm-observe" are:
sysdig-agent-65972   0/1     Init:0/1   0          5s
sysdig-agent-8j9ld   0/1     Init:0/1   0          5s

Make sure the above pods all turn to "Running" state before continuing
Should any pod not reach the "Running" state, further info can be obtained from logs as follows
'kubectl logs <agent-pod-name> -n ibm-observe'
PodがRunningステータスになるまで、5分ほどかかりました。
> oc get pods -n ibm-observe
NAME                 READY   STATUS    RESTARTS   AGE
sysdig-agent-65972   1/1     Running   0          4m38s
sysdig-agent-8j9ld   1/1     Running   0          4m38s
2.IBM Application Gatewayのコンテナから手動でログ送信してみる
Statsdの送信設定(サーバーとポート)を確認するため、IBM Application GatewayのPodにoc rshコマンドでアクセス、手動でログ連携ができるか確認していきました。
Podにアクセス:
>oc get pods
NAME           READY   STATUS      RESTARTS   AGE
iag-1-build    0/1     Completed   0          30m12s
iag-1-deploy   0/1     Completed   0          30m12s
iag-1-jlf2q    1/1     Running     0          30m12s

> oc rsh iag-1-jlf2q
ログ送信するコマンド例:
echo "hello_statsd:1|c" > /dev/udp/127.0.0.1/8125
試した組み合わせは、コレクター・エンドポイントとポート番号(6443)、Sysdigマニュアルにある127.0.0.1とポート番号(8125)です。
組み合わせて確認した結果、送信先は127.0.0.1、ポートは8125と[IBM APplication GatewayのサンプルYamlファイル(https://docs.verify.ibm.com/gateway/docs/yaml-logging-statistics)と同じ設定でIBM Cloud Monitoringにデータ送信ができました。
| ポート番号/サーバー | 6443 | 8125 |
|---|---|---|
| コレクター・エンドポイント(TOK) ingest.private.jp-tok.monitoring.cloud.ibm.com |
× | × |
| 127.0.0.1 | × | 〇(正解) |
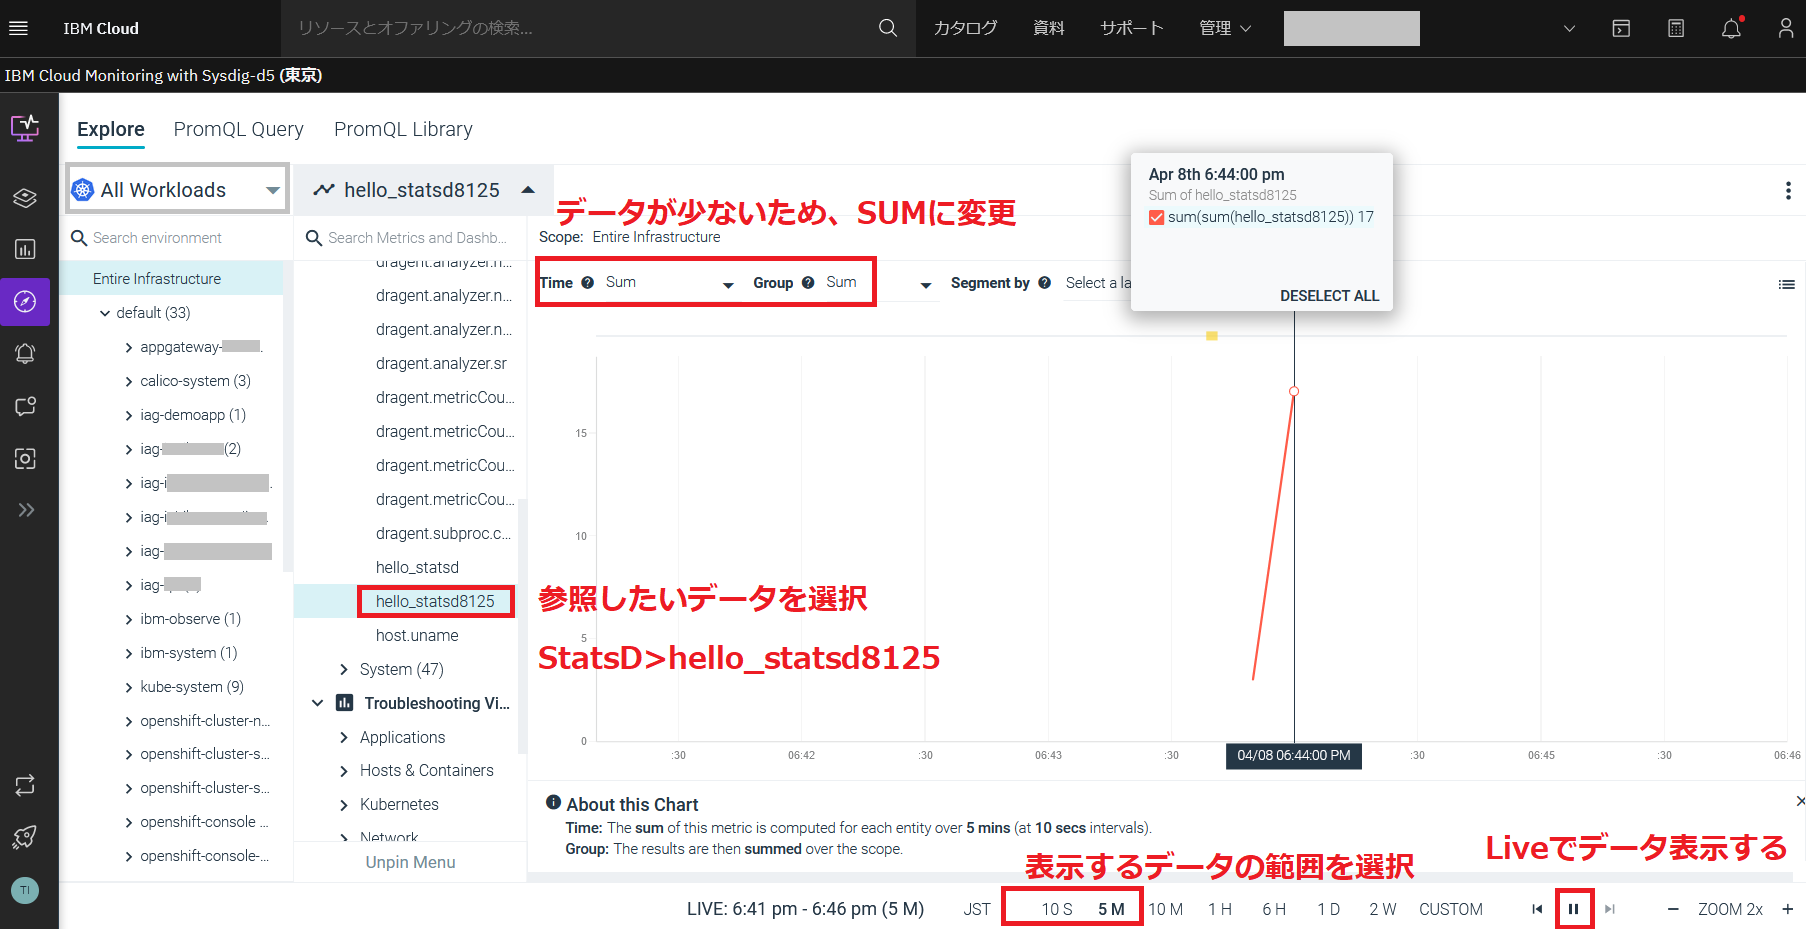
IBM Cloud Monitoringでデータが確認できました。
画面下の設定で、データをLiveにして、10秒とか5分でデータ参照するとわかりやすいかったです。
3.IBM Application Gatewayでテストアプリにアクセスして、ログ出力確認
IBM Application Gatewayで、Statsdに関する設定を行います。
StatsDサーバーに送信できる統計情報は、Enabling Statistics Gatheringに記載があります。
使えそうな統計はすべて送信対象としてみました。
~~省略~~~
logging:
  statistics:
    server: 127.0.0.1
    port: 8125
    frequency: 10
    components:
      - iag.https
      - iag.authn
      - iag.threads
      - iag.sescache
      - iag.redis
      - iag.resource_servers
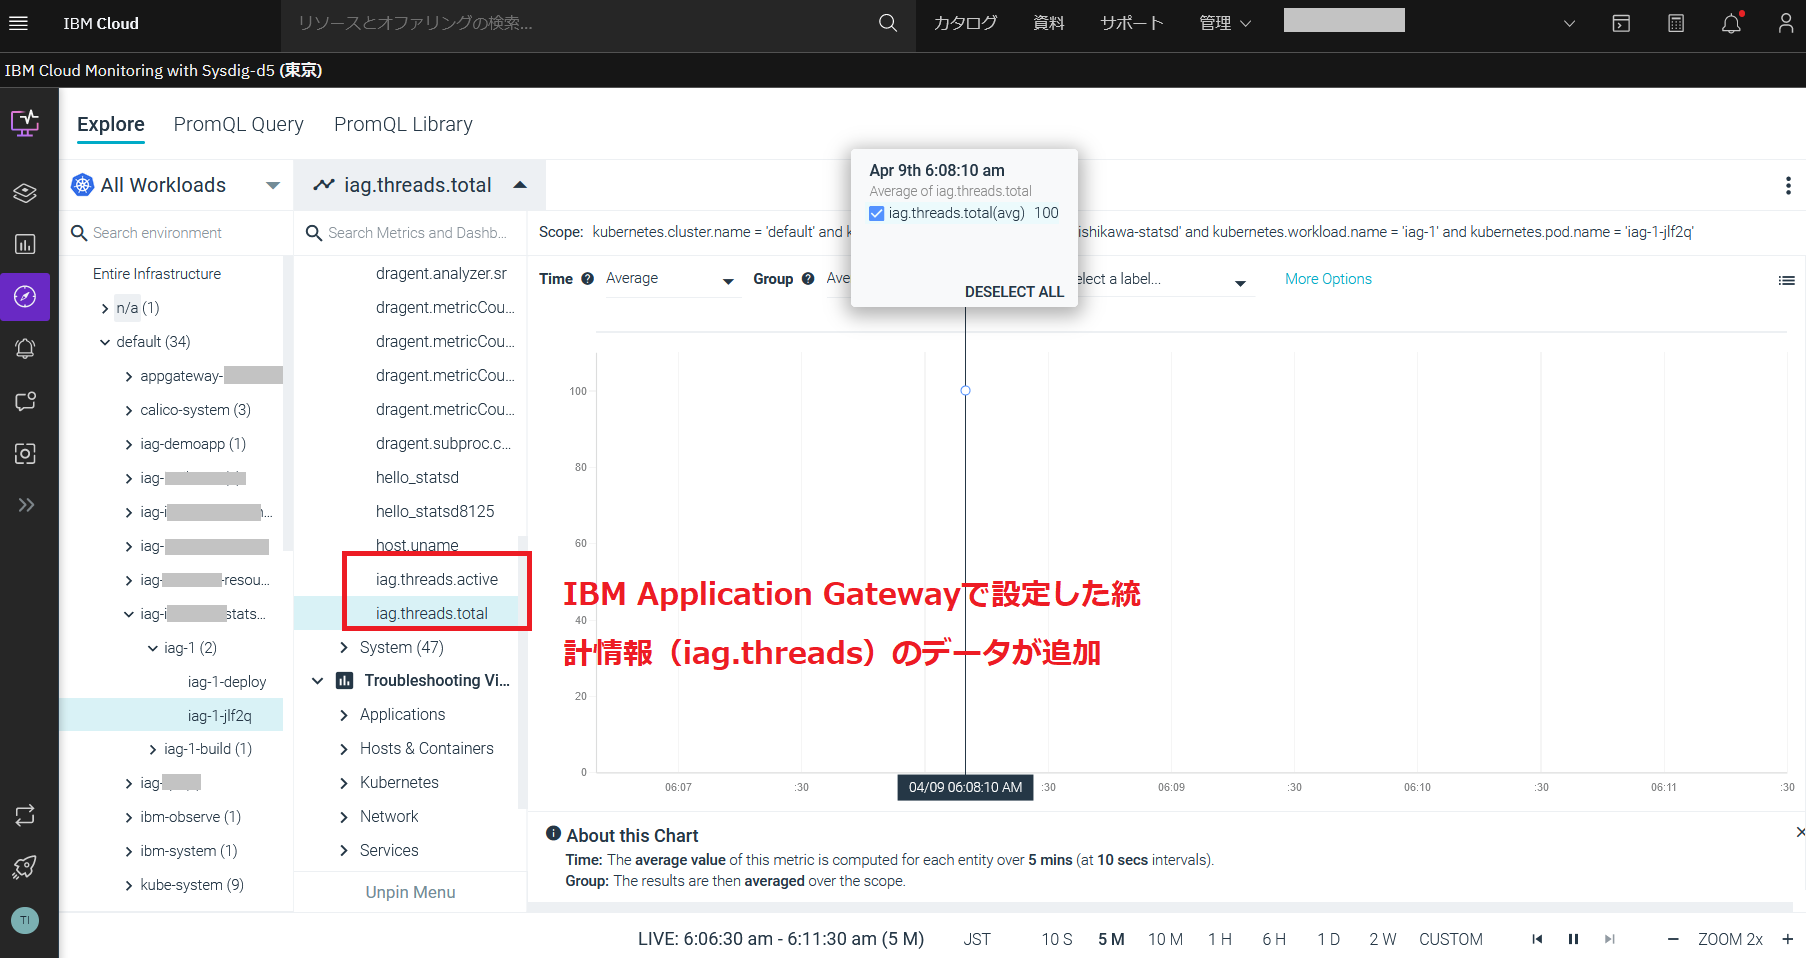
少し待つと、IBM Application Gatewayに設定した統計情報(iag.threads.activeなど)がIBM Cloud Monitoringに表示されました。
無事にIBM Cloud Log Analysisとの連携ができました。
最後に
IBM Cloud Monitoring with SysdigにIBM Application Gatewayの統計情報が送信できることまで確認できました。
後で気づきましたが、自動ではなく、手動でエージェントをデプロイする手順もありました。
OpenShift クラスターへのモニタリング・エージェントの手動デプロイ
今後IBM Application Gateway配下のアプリケーションにアクセスを増やしてみて、どのように統計情報が参照できるのか、確認してみたいと思います。