日本語化
import matplotlib.pyplot as plt
import japanize_matplotlib
保存(解像度も設定)
plt.savefig("name.png",format = 'png', dpi=300)
figureとaxesを同時作成
下記の例では、axは行×列数個の要素を持つ。
# figureという大きな領域を用意し、rows_graph×columns_graph個のグラフ描画領域を作成するイメージ
fig, ax = plt.subplots(rows_graph,columns_graph,figsize=(10,42))

# 各ax要素にアクセスし、プロット。
ax[i,j].plot(x,y)

# 複数描きたい場合は、for文(ネスト)で複数のグラフ描画
for j,day in enumerate(date_list):
    for i,item in enumerate(cal_items):
        ax[i,j].plot(x,y)
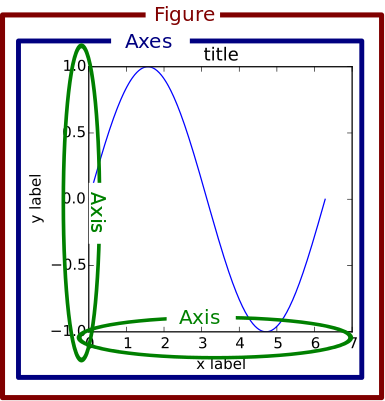
タイトル、軸、凡例関係
axisではなく、axesのメソッドであることに注意
ax.set_title('タイトル')
ax.set_xlabel('x軸名')
ax.set_ylabel('y軸名')
ax.set_xlim(min,max)
ax.set_ylim(min,max)
ax.legend(['A','B'])#系列が2つある時
https://matplotlib.org/1.5.1/faq/usage_faq.html#parts-of-a-figure