はじめに
JavaScriptでグラフ描画する際にはお馴染みのChart.js。
今回、Vueでグラフを表示する機会があったので、Chart.jsのラッパーであるvue-chartjsを利用してみました。
タイトルに「Laravel」「Vite」とありますが、たまたまLaravelのVue環境下で実装しただけなので、LaravelもViteも関係ないです![]()
パッケージの導入
まずはパッケージの導入です。
npm i vue-chartjs chart.js
棒グラフコンポーネントの作成
グラフは他画面で利用できるようにコンポーネント化します。
今回は棒グラフを利用するので、棒グラフのコンポーネントを作成しました。
そしてそのサンプルがこちら。
画面側のソースから受け取った表示データやラベル、グラフタイトルをChartjsへセットしています。
resources/ts/Components/BarChart.vue
<template>
    <Bar :data="data" :options="options" />
</template>

<script>
import {
    Chart as ChartJS,
    Title,
    Tooltip,
    Legend,
    BarElement,
    CategoryScale,
    LinearScale
} from 'chart.js'
import { Bar } from 'vue-chartjs'

ChartJS.register(CategoryScale, LinearScale, BarElement, Title, Tooltip, Legend)

export default {
    name: 'App',
    components: {
        Bar
    },
    props: {
        title: {
            type: String,
            default: ''
        },
        labels: {
            type: Array,
            default: []
        },
        data: {
            type: Array,
            default: []
        },
        backgroundColor: {
            type: String,
            default: '#E2E2E2'
        }
    },
    setup(props) {
        const data = {
            labels: props.labels,
            datasets: [
                {
                    label: props.title,
                    backgroundColor: props.backgroundColor,
                    data: props.data
                }
            ]
        }

        const options = {
            responsive: true,
            maintainAspectRatio: true,
            plugins: {
                legend: {
                    display: props.title ? true : false,
                    align: 'start',
                    labels: {
                        boxWidth: 0
                    }
                }
            },
            scales: {
                y: {
                    ticks: {
                        stepSize: 1
                    }
                }
            }
        }

        return {
            data,
            options,
        }
    },
}
</script>
棒グラフコンポーネントの呼び出し
作成した棒グラフコンポーネントは下記のようにして画面側のソースから呼び出せます。
<BarChart title="サンプル棒グラフ" :labels="labels" :data="data" />
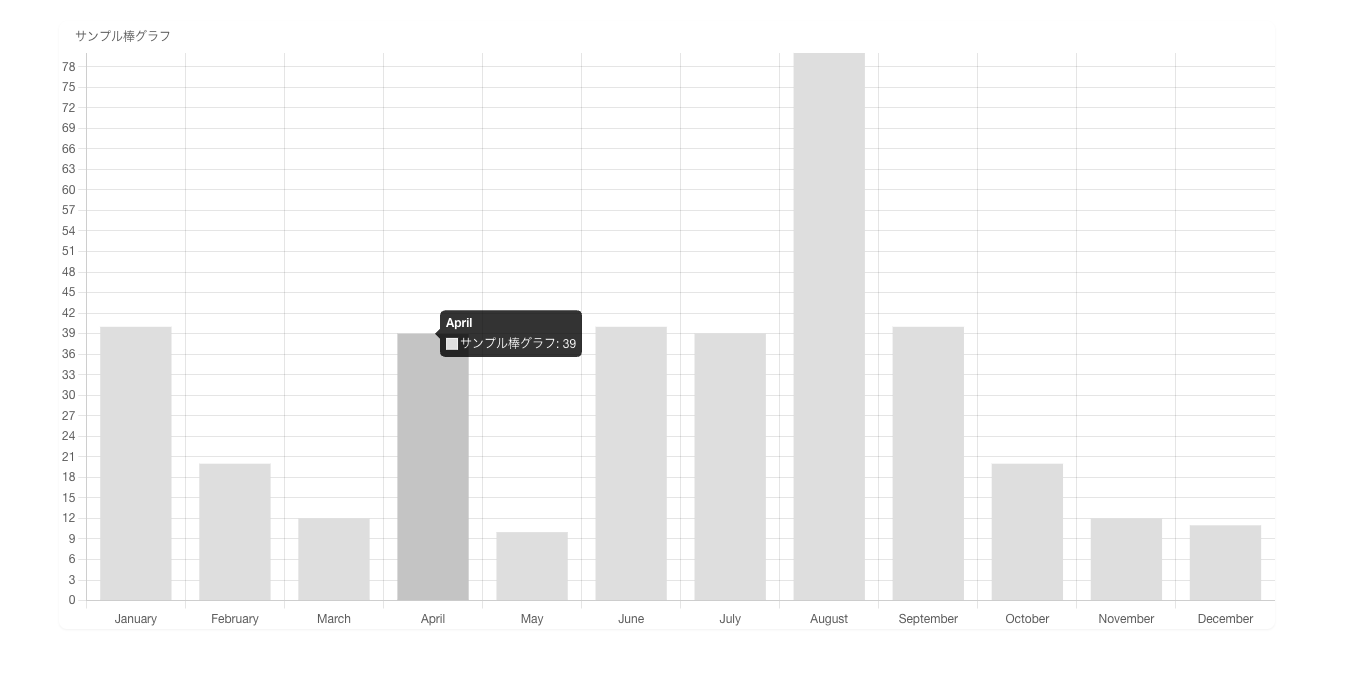
画面のサンプルがこちら。
resources/ts/Pages/Dashboard.vue
<script setup>
import { computed } from 'vue';
import BarChart from '@/Components/BarChart.vue'

const props = defineProps();

const labels = computed(() => {
    let labels = [
        'January',
        'February',
        'March',
        'April',
        'May',
        'June',
        'July',
        'August',
        'September',
        'October',
        'November',
        'December'
    ]
    return labels
});

const data = computed(() => {
    let counts = [40, 20, 12, 39, 10, 40, 39, 80, 40, 20, 12, 11]
    return counts
});
</script>

<template>
    <div class="py-8">
        <div class="max-w-7xl mx-auto sm:px-6 lg:px-8 mt-6">
            <div class="bg-white overflow-hidden shadow-sm sm:rounded-lg">
                <div>
                    <BarChart title="サンプル棒グラフ" :labels="labels" :data="data" />
                </div>
            </div>
        </div>
    </div>
</template>
無事、グラフの表示が行えました。
おわりに
記事にまとめると大したことないのですが、参考サイトを見つけるまではちょっと苦労しました。
「少しのことにも、先達はあらまほしき事なり」ですね。
参考