はじめに
決定木とは決定理論の分野において、決定を行うための木構造のグラフです。
決定木を使う場面として、回帰(回帰木:regression tree)と分類(分類木:classification tree)が存在しますが、分類に関して決定木の活用方法を確認していきたいと思います。
具体的には、文部科学省のページで公開されている情報Ⅱの教員研修教材内の「分類による予測」で取り上げられているものをpythonで実装しつつ、仕組みを確認していけたらと思います。
教材
高等学校情報科「情報Ⅱ」教員研修用教材(本編):文部科学省
第3章 情報とデータサイエンス 後半 (PDF:7.6MB)
環境
- ipython
- Colaboratory - Google Colab
教材内で取り上げる箇所
学習15 分類による予測:「2. 決定木による二値分類」
のRで書かれたソースコードをpythonで実装しつつ、仕組みを見ていきたいと思います。
今回取り扱うデータ
教材と同じように、kaggleからtitanicデータをダウンロードします。
今回使うのはtitanicの「train.csv」です。
これは、タイタニック号の事故に関して一部の乗客の「生存・死亡」「客室の等級」「性別」「年齢」等が記載されたデータです。
まずは、教材に載っているRでの実装をこちらでpythonに置き換えた実装例を挙げていきながら、決定木について理解を深めたいと思います。
pythonでの実装例と結果
データの読み込みと前処理(python)
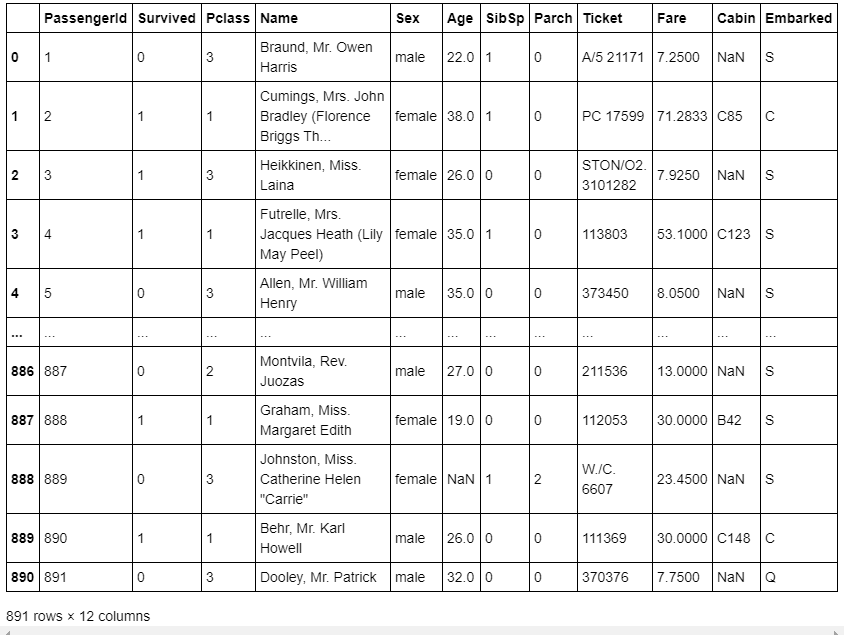
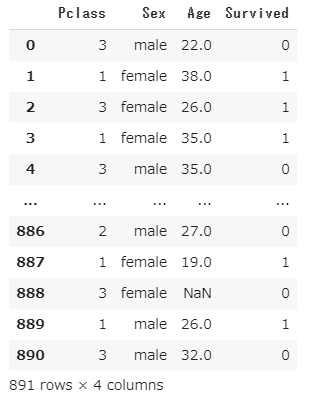
train.csvのうち、今回必要な、Pclass(客室の等級)、Sex(性別)、Age(年齢)、Survived(生存1,死亡0)の情報のみが必要なので、必要な部分のみ抽出します。
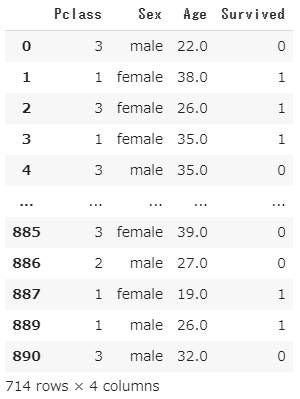
欠損値は'NaN'として取り扱っており、欠損値は取り除く方針で進めます。
元データの読み込み・データ抽出・欠損値処理(ソースコード)
import numpy as np
import pandas as pd
from IPython.display import display
from numpy import nan as NaN

titanic_train = pd.read_csv('/content/train.csv')

# 元データ表示
display(titanic_train)

# Pclass(客室の等級)、Sex(性別)、Age(年齢)、Survived(生存1,死亡0)
titanic_data = titanic_train[['Pclass', 'Sex', 'Age', 'Survived']]
display(titanic_data)

# 欠損値'NaN'は、取り除く
titanic_data = titanic_data.dropna()
display(titanic_data)

#  欠損値取り除かれているかデータ確認
titanic_data.isnull().sum()
元データの読み込み・データ抽出・欠損値処理(出力結果)
元データの読み込み
データ抽出
欠損値処理のデータ結果
欠損値取り除かれているかデータ確認
決定木の可視化の実行(ソースコード)
pythonによる決定木の可視化は、見た目がわかりやすいという理由で、dtreevizを使用しようと思います。
dtreevizインストール
!pip install dtreeviz pydotplus
決定木の可視化の実行
import sklearn.tree as tree
from dtreeviz.trees import dtreeviz

## maleを0に、femaleを1に変換
titanic_data["Sex"] = titanic_data["Sex"].map({"male":0,"female":1})

# 'Survived'列を覗いたデータを特徴行列
# 'Survived'列を目的変数
X_train = titanic_data.drop('Survived', axis=1)
Y_train = titanic_data['Survived']

# 決定木作成(木の最大の深さは3に指定した)
clf = tree.DecisionTreeClassifier(random_state=0, max_depth = 3)
model = clf.fit(X_train, Y_train)

viz = dtreeviz(
    model,
    X_train,
    Y_train,
    target_name = 'alive',
    feature_names = X_train.columns,
    class_names = ['Dead','Sruvived']
)

# 決定木表示
display(viz)
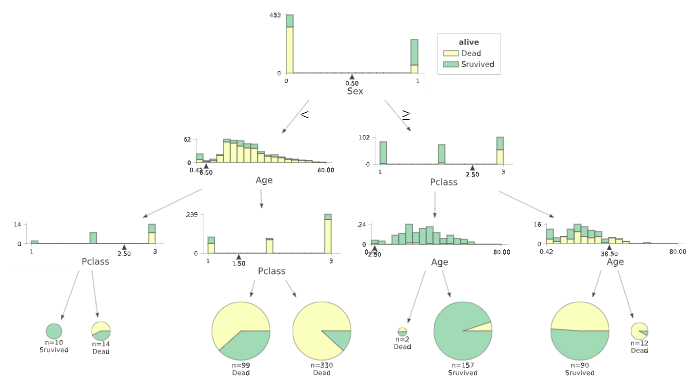
決定木の可視化の実行(出力)
決定木の分析では、どれだけ深い木まで分析をすすめるかという点を考慮する必要があります。
決定木は適度な深さで分析を止めるなどしないと、分析に使った訓練データに過剰に適合してしまう過学習(overfitting)が発生し、汎化性能が低下する恐れがあります。
今回表示の関係で、最大の深さ=3に指定しているので、そこまで深すぎる設定にはなっていませんが、教材では適度な複雑度(complexioty parameter)を指定して、木の剪定(pruning)を行っているので同様に進めたいと思います。
剪定
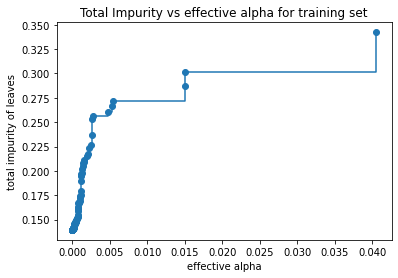
決定木の各ノードの条件分岐がうまい具合に作られているかを見る際に、不純度(impurity)というパラメータが使用される事が多く、この不純度というパラメータは、小さいほどよりシンプルな基準で分類ができていることを示します。
もう一つ関係する重要な要素として複雑度というパラメータがあり、これは木全体がどれだけ複雑かどうかということを示しています。
今回のソースコードでは、決定木の生成の際の不純度はジニ不純度というものが使われております。(DecisionTreeClassifier()の引数criterion{“gini”, “entropy”}, default=”gini”)
そして、決定木の生成方法としては、最小コスト複雑度剪定(Minimal cost-complexity pruning)というアルゴリズムを使っております。
これは、最小コスト複雑度剪定と言う通り、木の生成コストと呼ばれる(木の終端のノード数×木の複雑度+木の不純度)を最小とするような決定木を生成するアルゴリズムです。
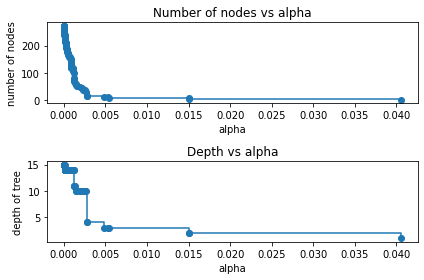
複雑度が大きいときは、終端のノード数が木の生成コストに強く影響を与え、最小コスト複雑度剪定で決定木を生成する場合、より"小さい木(深さやノード数が小さい)"が生成できます。
逆に複雑度が小さいときは、終端ノード数による木の生成コストの影響が小さくなり、同様に決定木を生成する場合、大きくて複雑な木(深さやノード数が小さい)が生成できます。
数式を使わずざっくりとしたイメージの話をしましたが、公式ドキュメントやそれ以外にも詳しく説明しているサイトはたくさんあるので、じっくり調べてみると良いかもしれません。
[参考] https://scikit-learn.org/stable/modules/tree.html#minimal-cost-complexity-pruning
剪定(ソースコード)
複雑度に関するパラメータと不純度に関するパラメータの関係
import matplotlib.pyplot as plt

# 決定木作成(木の最大の深さ指定なし)
clf = tree.DecisionTreeClassifier(random_state=0)
model = clf.fit(X_train, Y_train)

path = clf.cost_complexity_pruning_path(X_train, Y_train)
# ccp_alphas:複雑度に関するパラメータ
# impurities:不純度に関するパラメータ
ccp_alphas, impurities = path.ccp_alphas, path.impurities

fig, ax = plt.subplots()
ax.plot(ccp_alphas[:-1], impurities[:-1], marker='o', drawstyle="steps-post")
ax.set_xlabel("effective alpha")
ax.set_ylabel("total impurity of leaves")
ax.set_title("Total Impurity vs effective alpha for training set")
複雑度に関するパラメータと生成されるノード数や木の深さの関係
clfs = []
for ccp_alpha in ccp_alphas:
    clf = tree.DecisionTreeClassifier(random_state=0, ccp_alpha=ccp_alpha)
    clf.fit(X_train, Y_train)
    clfs.append(clf)
print("Number of nodes in the last tree is: {} with ccp_alpha: {}".format(
      clfs[-1].tree_.node_count, ccp_alphas[-1]))

clfs = clfs[:-1]
ccp_alphas = ccp_alphas[:-1]

node_counts = [clf.tree_.node_count for clf in clfs]
depth = [clf.tree_.max_depth for clf in clfs]
fig, ax = plt.subplots(2, 1)
ax[0].plot(ccp_alphas, node_counts, marker='o', drawstyle="steps-post")
ax[0].set_xlabel("alpha")
ax[0].set_ylabel("number of nodes")
ax[0].set_title("Number of nodes vs alpha")
ax[1].plot(ccp_alphas, depth, marker='o', drawstyle="steps-post")
ax[1].set_xlabel("alpha")
ax[1].set_ylabel("depth of tree")
ax[1].set_title("Depth vs alpha")
fig.tight_layout()
剪定(出力結果)
複雑度に関するパラメータと不純度に関するパラメータの関係
複雑度に関するパラメータと生成されるノード数や木の深さの関係
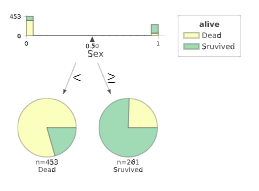
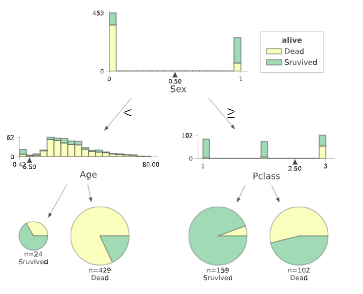
教材では、深さ1~2程度の木になるように剪定を行っているので、複雑度に関するパラメータccp_alphaを0.041あたりだと深さが1、ノード数1くらいで、ccp_alphaが0.0151あたりだと深さ2、ノード数3くらいになりそうであることがわかります。
剪定後の決定木(ソースコード)
ccp_alpha=0.041
clf = tree.DecisionTreeClassifier(ccp_alpha = 0.041)
model = clf.fit(X_train, Y_train)

viz = dtreeviz(
    model,
    X_train,
    Y_train,
    target_name = 'alive',
    feature_names = X_train.columns,
    class_names = ['Dead','Sruvived']
)

display(viz)
ccp_alpha=0.0151
clf = tree.DecisionTreeClassifier(ccp_alpha = 0.0151)
model = clf.fit(X_train, Y_train)

viz = dtreeviz(
    model,
    X_train,
    Y_train,
    target_name = 'alive',
    feature_names = X_train.columns,
    class_names = ['Dead','Sruvived']
)

display(viz)
剪定後の決定木(出力結果)
ccp_alpha=0.041
ccp_alpha=0.0151
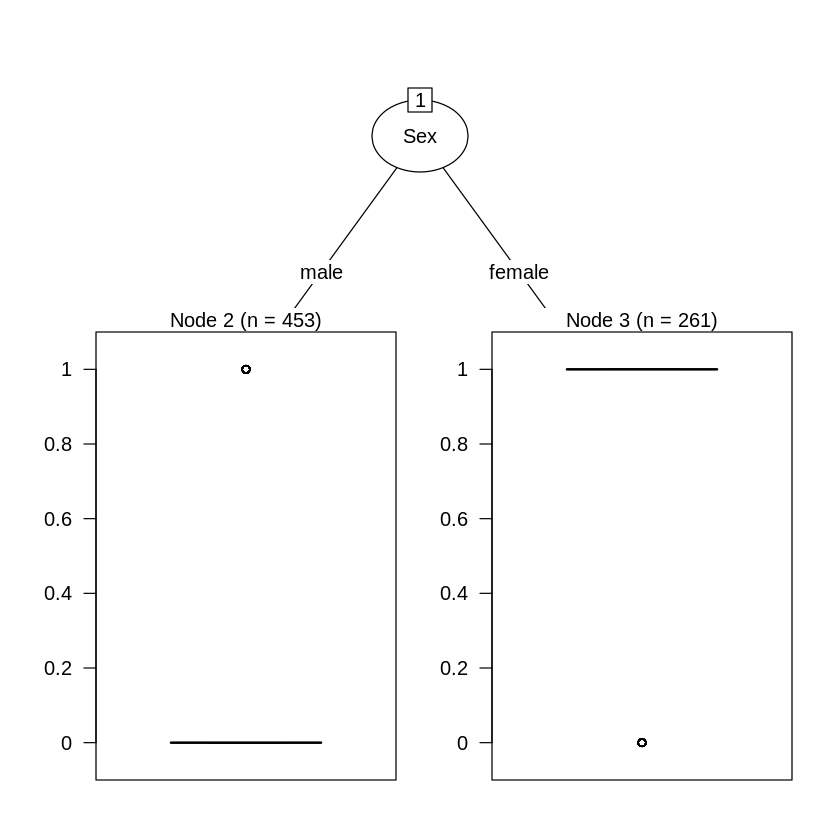
これらを見ると、生死を分ける最大要因は、性別であり女性のほうが救助されやすかったことがわかります。
男性であっても、年齢が若い(=子ども)であるほど生存率は高いことがわかります。
女性であれば、客室の等級が高いほど生存率が高いように読み取れます。
コメント
教材では以下のような記述になっております。
この事故の生死をこの事故の生死を決める最大の要素は,性別であった。乗務員が積極的に女性や子供を救助したことも読み取れる。また,船室の優劣は生死を決める要因にはなっていないようである。
私のほうで実装し出力させた結果では、船室の優劣も生死を決める要因になっているようにみえました。
pythonであっても、Rであっても決定木の構成は相違ないものでしたので、教材の結果だけを見るだけでなく、実際に実行してみて自分なりに分析してみることが大切だと思いました。
[参考]Rでの実装例と結果(教材より)
データの読み込みと前処理(R)
元データの読み込み(ソースコード)
titanic.train<-read.csv("/content/train.csv") # データの場所を指定
str(titanic.train)
### 元データの読み込み(出力結果)

> ```console
'data.frame':	891 obs. of  12 variables:
 $ PassengerId: int  1 2 3 4 5 6 7 8 9 10 ...
 $ Survived   : int  0 1 1 1 0 0 0 0 1 1 ...
 $ Pclass     : int  3 1 3 1 3 3 1 3 3 2 ...
 $ Name       : Factor w/ 891 levels "Abbing, Mr. Anthony",..: 109 191 358 277 16 559 520 629 417 581 ...
 $ Sex        : Factor w/ 2 levels "female","male": 2 1 1 1 2 2 2 2 1 1 ...
 $ Age        : num  22 38 26 35 35 NA 54 2 27 14 ...
 $ SibSp      : int  1 1 0 1 0 0 0 3 0 1 ...
 $ Parch      : int  0 0 0 0 0 0 0 1 2 0 ...
 $ Ticket     : Factor w/ 681 levels "110152","110413",..: 524 597 670 50 473 276 86 396 345 133 ...
 $ Fare       : num  7.25 71.28 7.92 53.1 8.05 ...
 $ Cabin      : Factor w/ 148 levels "","A10","A14",..: 1 83 1 57 1 1 131 1 1 1 ...
 $ Embarked   : Factor w/ 4 levels "","C","Q","S": 4 2 4 4 4 3 4 4 4 2 ...
データ抽出(ソースコード)
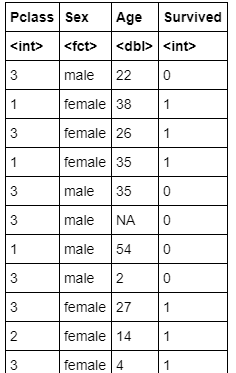
titanic.data<-titanic.train[,c("Pclass","Sex","Age","Survived")]
titanic.data
### データ抽出(出力結果)
> 
### 欠損値(NA)(ソースコード)
> ```R
titanic.data<-na.omit(titanic.data)
決定木の可視化の実行(ソースコード)
install.packages("partykit")
library(rpart)
library(partykit)
titanic.ct<-rpart(Survived~.,data=titanic.data, method="class")
plot(as.party(titanic.ct),tp_arg=T)
### 決定木の可視化の実行(出力結果)
> <img width="480" alt="ダウンロード (12).png" src="https://qiita-image-store.s3.ap-northeast-1.amazonaws.com/0/677025/4c8bf0fc-369b-137d-21b4-4c41e77c0741.png">

### 分類木のCP(ソースコード)

> ```R
printcp(titanic.ct)
分類木のCP(出力結果)
Classification tree:
rpart(formula = Survived ~ ., data = titanic.data, method = "class")
Variables actually used in tree construction:
[1] Age Pclass Sex
Root node error: 290/714 = 0.40616
n= 714
CP nsplit rel error xerror xstd
1 0.458621 0 1.00000 1.00000 0.045252
2 0.027586 1 0.54138 0.54138 0.038162
3 0.012069 3 0.48621 0.53793 0.038074
4 0.010345 5 0.46207 0.53448 0.037986
5 0.010000 6 0.45172 0.53793 0.038074
### CPを0.028にした場合の分類木(ソースコード)

> ```R
titanic.ct2<-rpart(Survived~.,data=titanic.data, method="class", cp=0.028)
plot(as.party(titanic.ct2))
決定木の可視化の実行(出力結果)
CPを0.027にした場合の分類木(ソースコード)
titanic.ct3<-rpart(Survived~.,data=titanic.data, method="class", cp=0.027)
plot(as.party(titanic.ct3))
### 決定木の可視化の実行(出力結果)

> <img width="480" alt="ダウンロード (14).png" src="https://qiita-image-store.s3.ap-northeast-1.amazonaws.com/0/677025/74101e1b-623e-94c1-40a5-8a700a5e7ec2.png">

# ソースコード
python版
https://gist.github.com/ereyester/dfb4fd6fb3e58c5d0539866f7e2622b4

R版
https://gist.github.com/ereyester/182d5d49ea04be579da2ffc82412a82a
