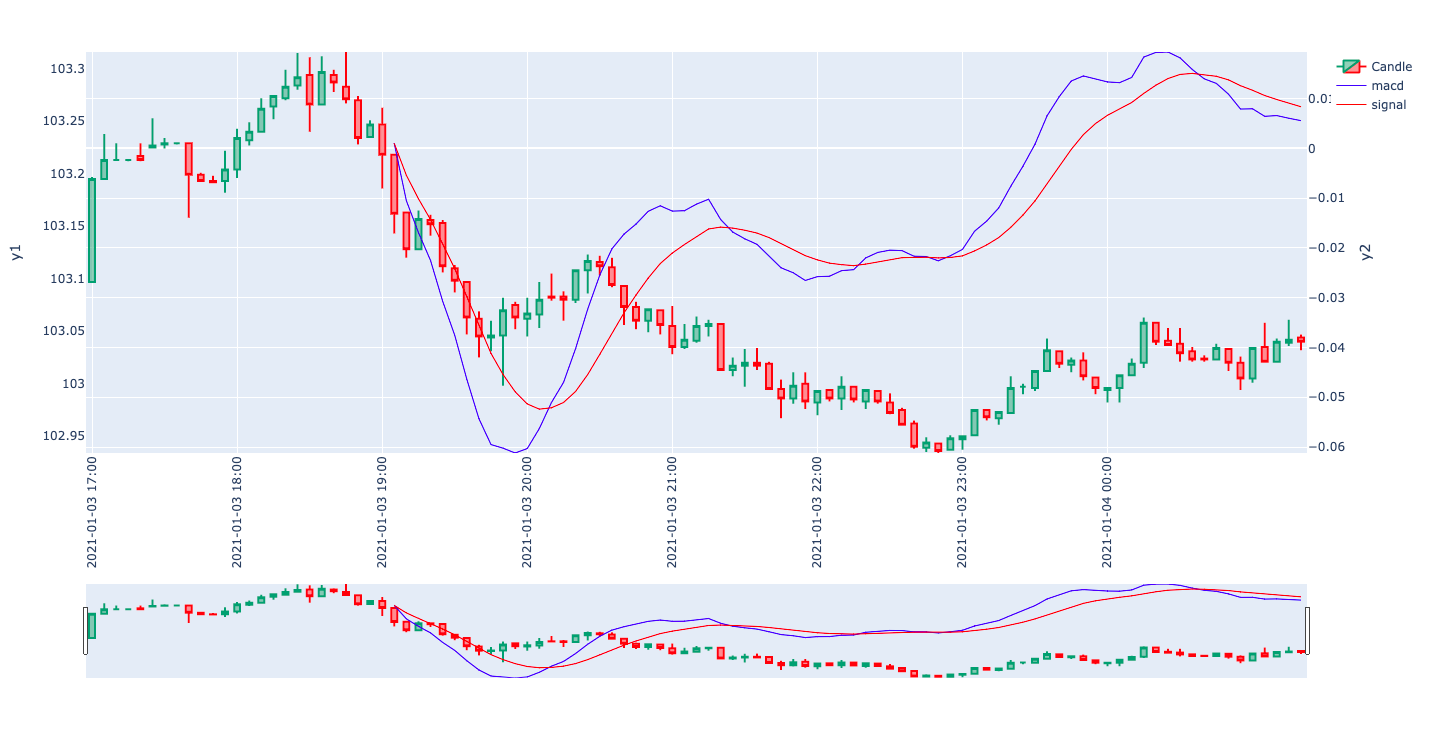
MACDの値はY軸の単位が違うので、ローソク足チャートと同時に表示するにはY軸が2つ必要になる。PlotlyでY軸2つを設定する方法をやってた。ここではグラフ表示部分のコードだけ紹介。MACDの計算やらはなんとなく察してどうぞ。
参考
Plotlyを使ったグラフ化は以下でもやってます。こちらはY軸1つ。
MACDの計算方法は以下でやってます。
コード
# グラフ化
interval = 12
vals = []
labels = []
for i in range(len(df)//interval):
    vals.append(df.index[i*interval])
    labels.append(df.index[i*interval].strftime('%Y-%m-%d %H:%M'))

fig = go.Figure(
        data=[
                go.Candlestick(
                    x=df.index,
                    open=df.Open,
                    high=df.High,
                    low=df.Low,
                    close=df.Close,
                    hovertext=['date:{}<br>open:{}<br>high:{}<br>low:{}<br>close:{}'
                        .format(i.strftime('%Y-%m-%d %H:%M'),
                                df.loc[i,'Open'],
                                df.loc[i,'High'],
                                df.loc[i,'Low'],
                                df.loc[i,'Close']) for i in df.index],
                    hoverinfo="text",
                    name="Candle",
                    yaxis='y1'
                ),
                go.Scatter(x=df.index, y=df.MACD, line=dict(color='blue', width=1), name="macd", yaxis='y2'),
                go.Scatter(x=df.index, y=df.Signal, line=dict(color='red', width=1), name="signal", yaxis='y2')
            ],
        layout = go.Layout(
                xaxis = dict(
                    ticktext = labels,
                    tickvals = vals,
                    tickangle = -90
                ),
                yaxis = dict(title='y1', side='left', showgrid=False, range=[df.Low.min(), df.High.max()]),
                yaxis2 = dict(title='y2', side='right', overlaying='y', range=[min(df.Signal.min(), df.MACD.min()), max(df.MACD.max(), df.Signal.max())])
        )
)
fig.show()
グラフ
ちょっと説明
go.Candlestick、go.Scatterの引数でY軸を指定してる。デフォルトだとy1が左でy2が右。その後、layoutでyaxis(=左)とyaxis2(=右)の設定をしている。yaxis2でoverlayingを指定しとかないとyaxisを上書きしてy1のデータがグラフに表示されないので注意。
rangeでY軸の最小値と最大値を指定できるので、適宜計算する。
感想
Plotly便利だなぁ(小並感)
