次の JSON を CORS のヘッダーがある形で受信します。
Access-Control-Allow-Origin: *
cities_array.json
[
  {"key": "t0921", "name": "宇都宮", "population": 41295, "date_mod": "2003-8-12" },
  {"key": "t0922", "name": "小山", "population": 38756, "date_mod": "2003-5-15" },
  {"key": "t0923", "name": "佐野", "population": 71294, "date_mod": "2003-6-8" },
  {"key": "t0924", "name": "足利", "population": 27138, "date_mod": "2003-7-21" },
  {"key": "t0925", "name": "日光", "population": 74682, "date_mod": "2003-4-19" },
  {"key": "t0926", "name": "下野", "population": 82951, "date_mod": "2003-10-14" },
  {"key": "t0927", "name": "さくら", "population": 96823, "date_mod": "2003-5-24" },
  {"key": "t0928", "name": "矢板", "population": 57926, "date_mod": "2003-2-12" },
  {"key": "t0929", "name": "真岡", "population": 64187, "date_mod": "2003-11-14" },
  {"key": "t0930", "name": "栃木", "population": 82354, "date_mod": "2003-7-04" },
  {"key": "t0931", "name": "大田原", "population": 72681, "date_mod": "2003-9-17" },


  {"key": "t0932", "name": "鹿沼", "population": 23749, "date_mod": "2003-7-20" },
  {"key": "t0933", "name": "那須塩原", "population": 12759, "date_mod": "2003-3-12" },
  {"key": "t0934", "name": "那須烏山", "population": 62531, "date_mod": "2003-8-17" }
]
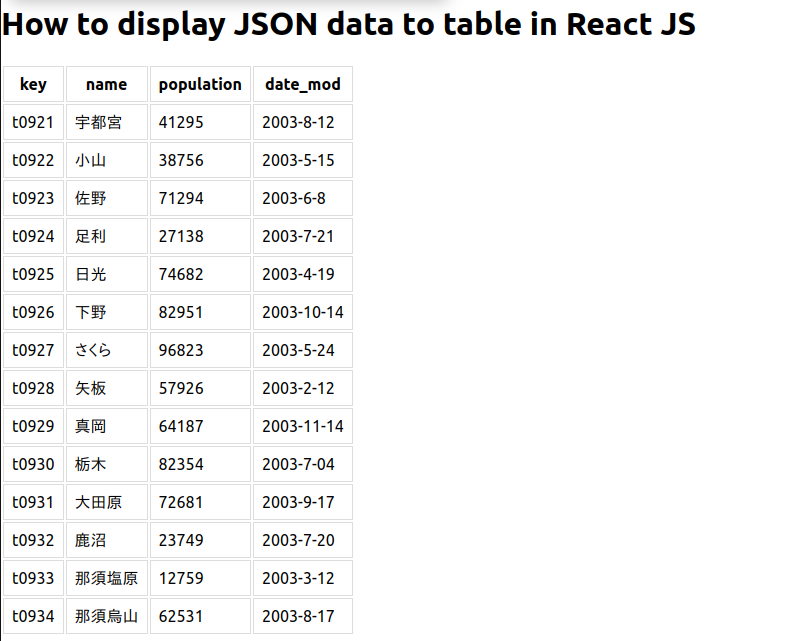
次のように表示します。
プロジェクトの作成と実行
create-react-app ex05
cd ex05
yarn start
次のファイルを書き換えます。
src/App.js
import React, { useState, useEffect } from 'react';
import './App.css';

function TableData() {
    const [data, getData] = useState([])
    const URL = 'https://example.com/cities_array.json';

    useEffect(() => {
        fetchData()
    }, [])


    const fetchData = () => {
        fetch(URL)
            .then((res) =>
                res.json())

            .then((response) => {
                console.log(response);
                getData(response);
            })

              }

    return (
        <>
            <h1>How to display JSON data to table in React JS</h1>
            <table>
            <thead>
                <tr>
                    <th>key</th>
                    <th>name</th>
                    <th>population</th>
                    <th>date_mod</th>
                </tr>
            </thead>
            <tbody>
                {data.map((item, i) => (
                    <tr key={i}>
                        <td>{item.key}</td>
                        <td>{item.name}</td>
                        <td>{item.population}</td>
                        <td>{item.date_mod}</td>
                    </tr>
                ))}

                       </tbody>
            </table>

        </>
    );
}

export default TableData;
src/App.css
/* -------------------------------------------------------------- */
/*

        App.css

                                                Aug/03/2022

*/
/* -------------------------------------------------------------- */
td, th {
   border: 1px solid #ddd;
   padding: 8px;
 }

/* -------------------------------------------------------------- */