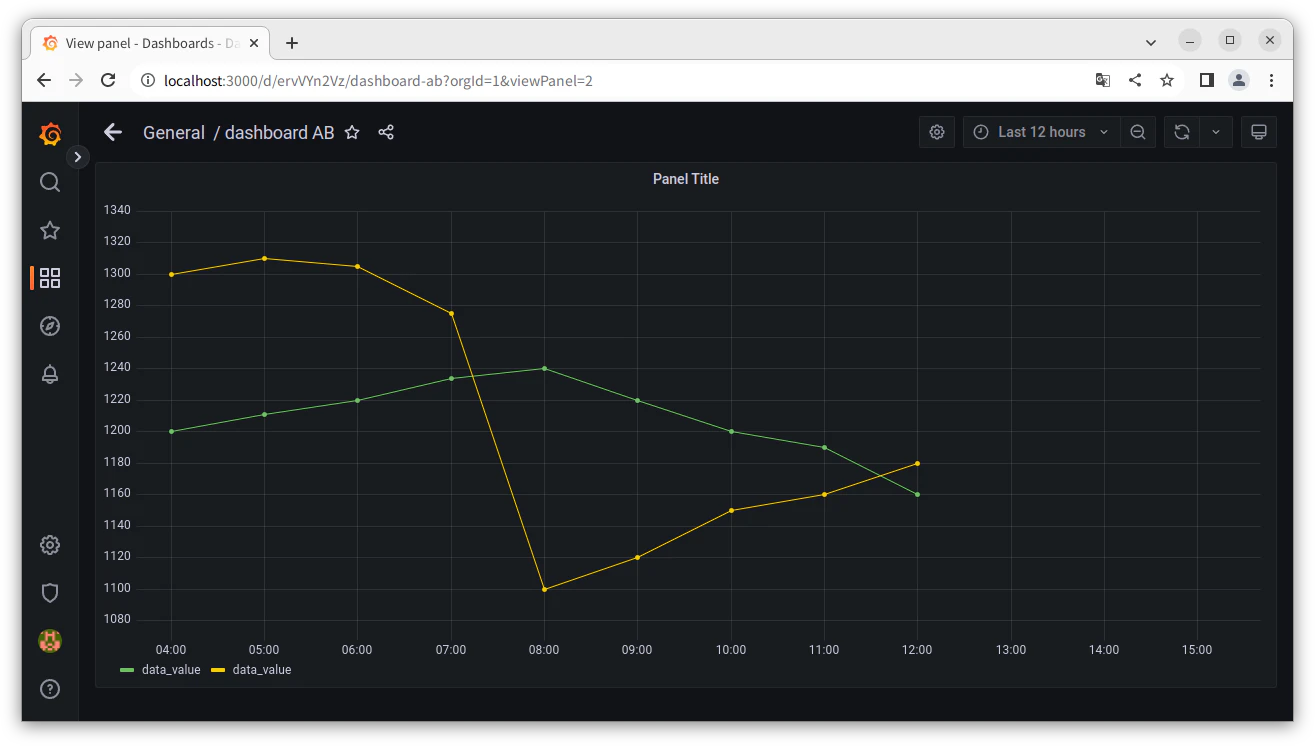
Grafana で次のようなグラフを作成する方法です。
データは、MariaDB に入れます。
次のページを参考にしました。
MySQLのデータをgrafanaで表示させてみた
Download Grafana
Ubuntu 22.10 で Grafana をインストールする方法
sudo apt install -y adduser libfontconfig1
wget https://dl.grafana.com/oss/release/grafana_9.3.2_amd64.deb
sudo dpkg -i grafana_9.3.2_amd64.deb
起動の確認
sudo systemctl status grafana-server
データの用意
MariaDB に次のデータベースを作成します。
user: scott
password: tiger123
database: grafana_db
データベースの作成方法
MariaDB [(none)]> create database grafana_db;
Query OK, 1 row affected (0.001 sec)

MariaDB [(none)]> grant all on grafana_db.* to 'scott'@'localhost';
Query OK, 0 rows affected (0.004 sec)
テーブルの作成
mysql -uscott -ptiger123 < create_table.sql
create_table.sql
use grafana_db;
CREATE TABLE IF NOT EXISTS sample_table (
    id VARCHAR(10),
    data_time DATETIME,
    data_value int(10),
    PRIMARY KEY( id, data_time )
);
exit
データの挿入
mysql -uscott -ptiger123 < insert01.sql
insert01.sql
use grafana_db;
delete from sample_table;
INSERT INTO `sample_table` VALUES ('1001','2023-01-6 04:00:00', 1200);
INSERT INTO `sample_table` VALUES ('1001','2023-01-6 05:00:00', 1211);
INSERT INTO `sample_table` VALUES ('1001','2023-01-6 06:00:00', 1220);
INSERT INTO `sample_table` VALUES ('1001','2023-01-6 07:00:00', 1234);
INSERT INTO `sample_table` VALUES ('1001','2023-01-6 08:00:00', 1240);
INSERT INTO `sample_table` VALUES ('1001','2023-01-6 09:00:00', 1220);
INSERT INTO `sample_table` VALUES ('1001','2023-01-6 10:00:00', 1200);
INSERT INTO `sample_table` VALUES ('1001','2023-01-6 11:00:00', 1190);
INSERT INTO `sample_table` VALUES ('1001','2023-01-6 12:00:00', 1160);
INSERT INTO `sample_table` VALUES ('1002','2023-01-6 04:00:00', 1300);
INSERT INTO `sample_table` VALUES ('1002','2023-01-6 05:00:00', 1310);
INSERT INTO `sample_table` VALUES ('1002','2023-01-6 06:00:00', 1305);
INSERT INTO `sample_table` VALUES ('1002','2023-01-6 07:00:00', 1275);
INSERT INTO `sample_table` VALUES ('1002','2023-01-6 08:00:00', 1100);
INSERT INTO `sample_table` VALUES ('1002','2023-01-6 09:00:00', 1120);
INSERT INTO `sample_table` VALUES ('1002','2023-01-6 10:00:00', 1150);
INSERT INTO `sample_table` VALUES ('1002','2023-01-6 11:00:00', 1160);
INSERT INTO `sample_table` VALUES ('1002','2023-01-6 12:00:00', 1180);
exit
2023-01-6 は当日に書き換えて下さい。
データの確認
MariaDB [grafana_db]> select * from grafana_db.sample_table;
+------+---------------------+------------+
| id   | data_time           | data_value |
+------+---------------------+------------+
| 1001 | 2023-01-06 04:00:00 |       1200 |
| 1001 | 2023-01-06 05:00:00 |       1211 |
| 1001 | 2023-01-06 06:00:00 |       1220 |
| 1001 | 2023-01-06 07:00:00 |       1234 |
| 1001 | 2023-01-06 08:00:00 |       1240 |
| 1001 | 2023-01-06 09:00:00 |       1220 |
| 1001 | 2023-01-06 10:00:00 |       1200 |
| 1001 | 2023-01-06 11:00:00 |       1190 |
| 1001 | 2023-01-06 12:00:00 |       1160 |
| 1002 | 2023-01-06 04:00:00 |       1300 |
| 1002 | 2023-01-06 05:00:00 |       1310 |
| 1002 | 2023-01-06 06:00:00 |       1305 |
| 1002 | 2023-01-06 07:00:00 |       1275 |
| 1002 | 2023-01-06 08:00:00 |       1100 |
| 1002 | 2023-01-06 09:00:00 |       1120 |
| 1002 | 2023-01-06 10:00:00 |       1150 |
| 1002 | 2023-01-06 11:00:00 |       1160 |
| 1002 | 2023-01-06 12:00:00 |       1180 |
+------+---------------------+------------+
18 rows in set (0.000 sec)
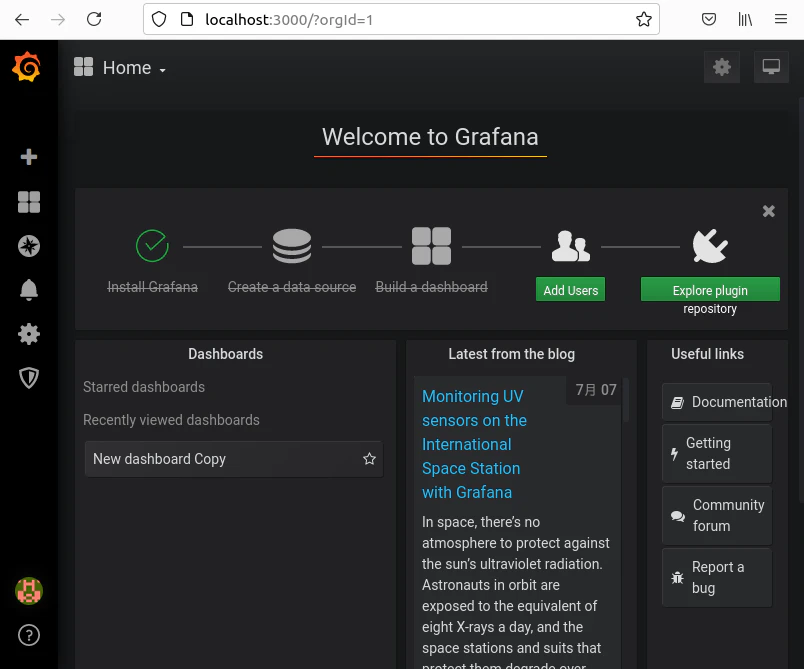
Grafana の操作
http://localhost:3000/
にアクセス
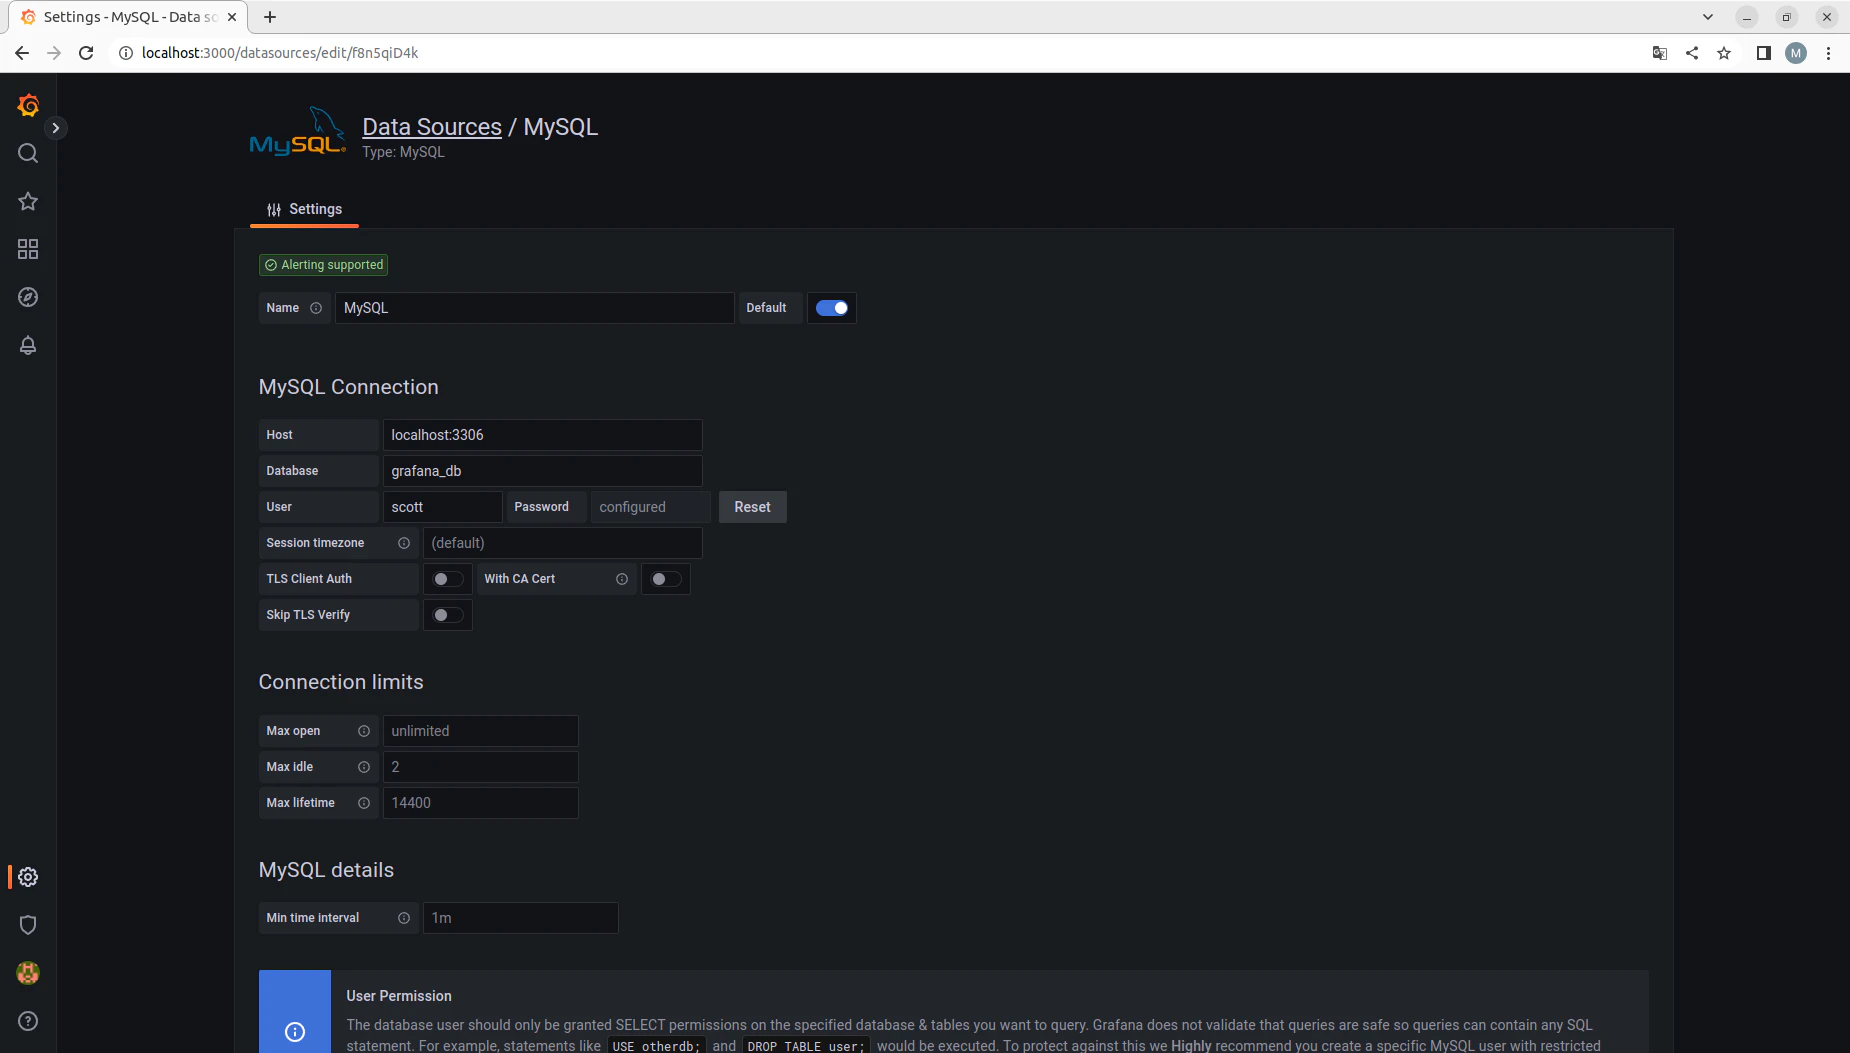
データソースの設定
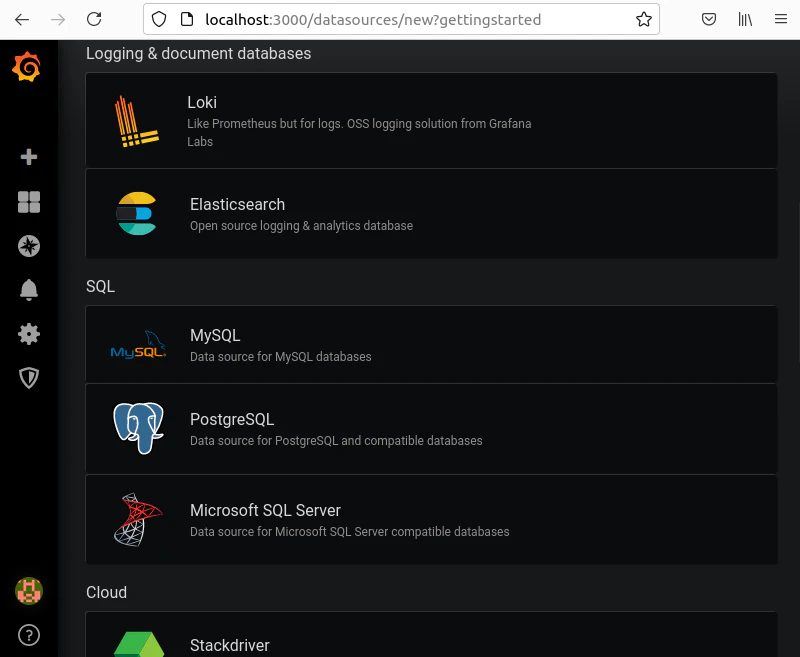
MySQL を選びます。
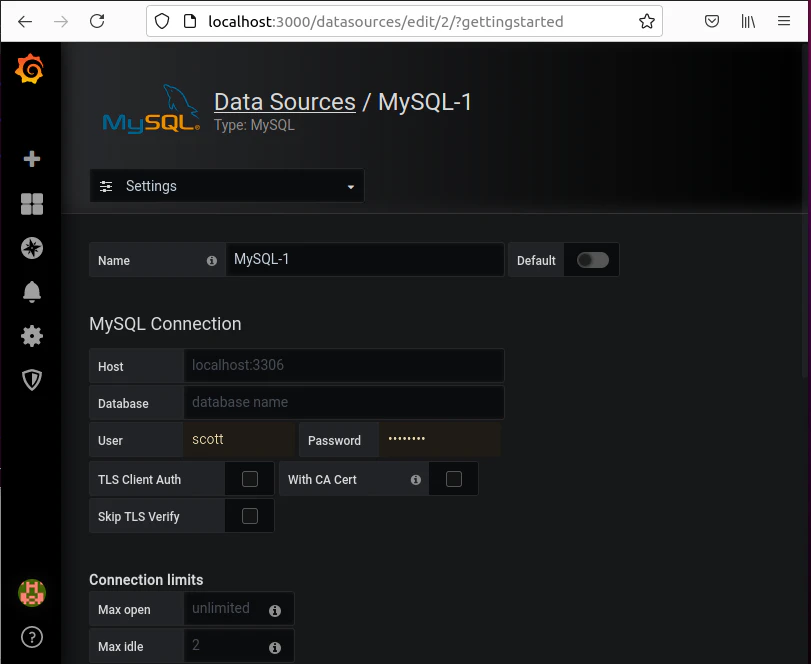
接続情報を入力して、'Save & Test' をクリックします。

Dashboard を作成します。
Code を選んで、次の Query を入れます。
A (MySQL)
SELECT
  UNIX_TIMESTAMP(data_time) AS "time",
  id AS metric,
  data_value
FROM sample_table
WHERE
  $__timeFilter(data_time) and id = '1001'
ORDER BY data_time
B (MySQL)
SELECT
  UNIX_TIMESTAMP(data_time) AS "time",
  id AS metric,
  data_value
FROM sample_table
WHERE
  $__timeFilter(data_time) and id = '1002'
ORDER BY data_time
Format を Time series にします。
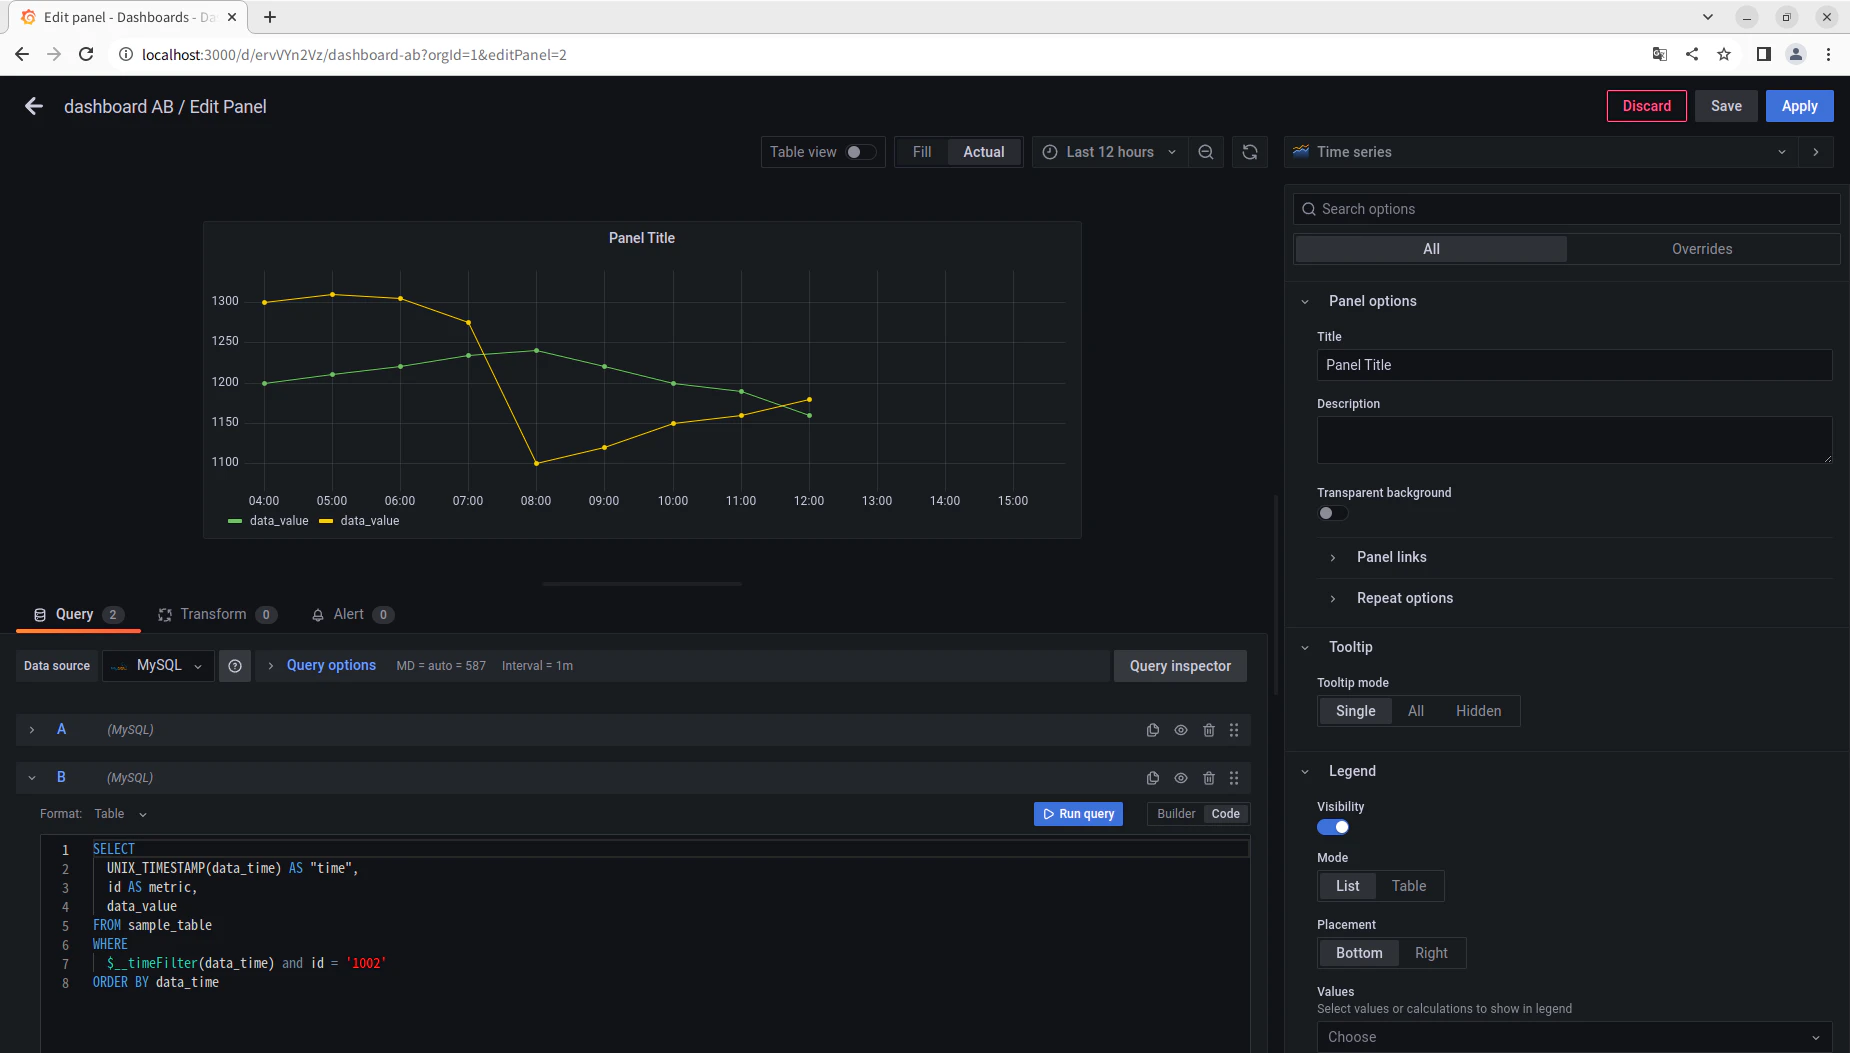
テストデータのタイムスタンプが最近 12H に入らなかったら、Last 24H に変えてみて下さい。それでもグラフが表示されなかったら、テストデータのタイムスタンプが古すぎる可能性があります。
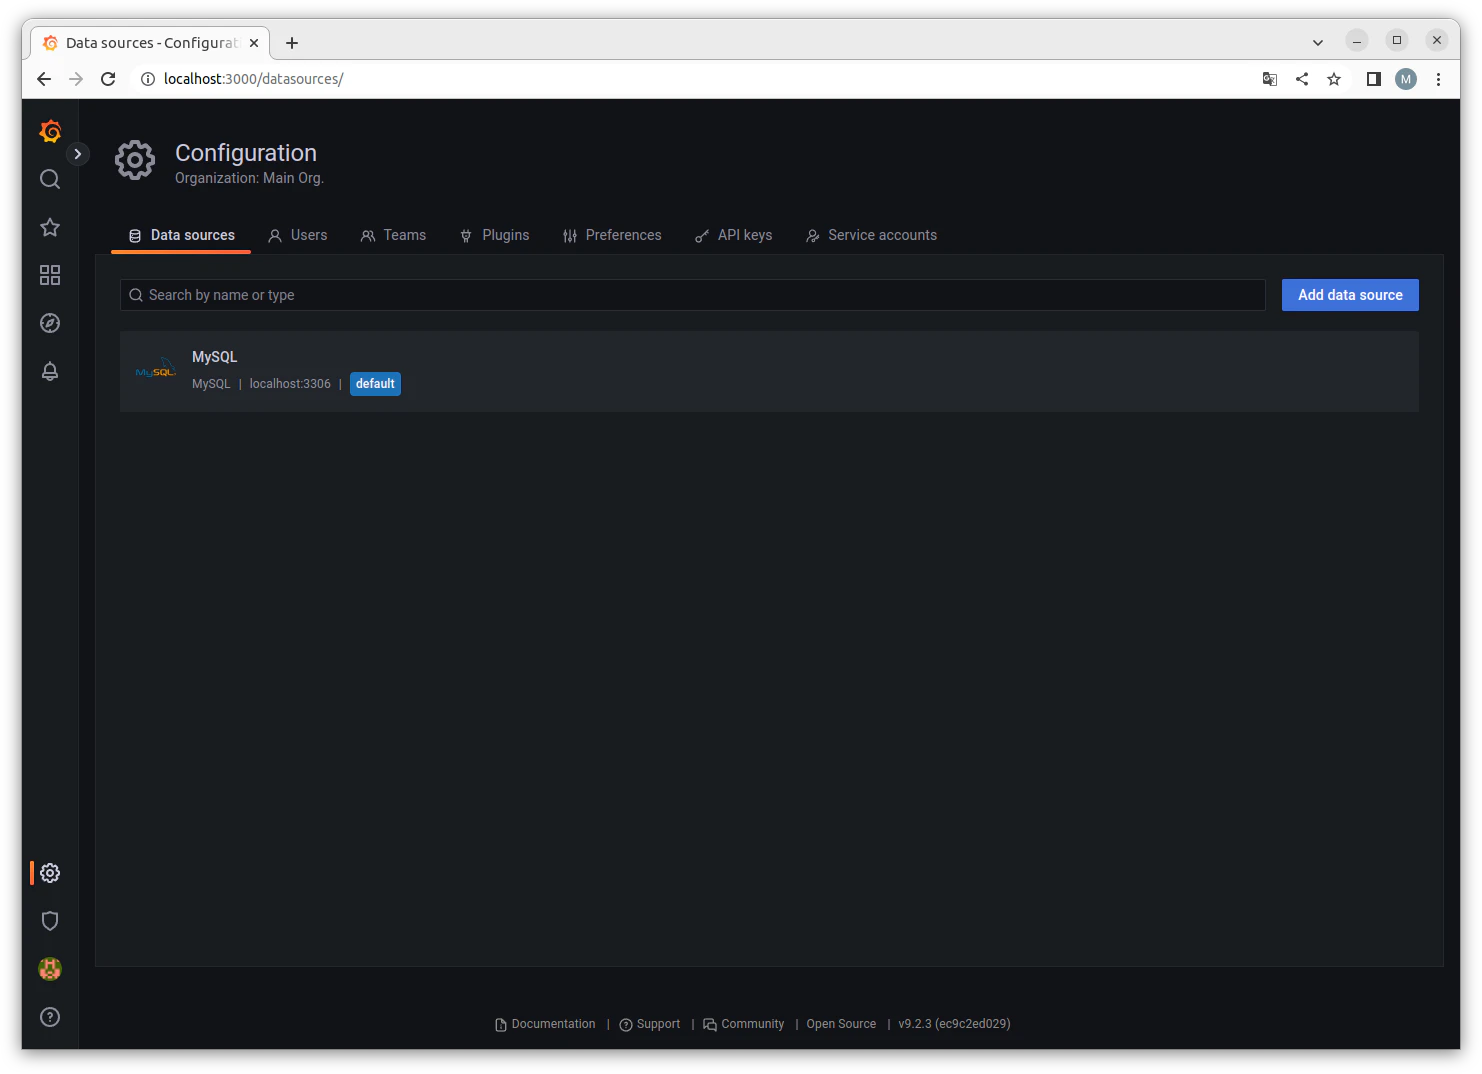
データソースの確認方法
Configuration -> Data Sources
又は、
http://localhost:3000/datasources/
次のバージョンで確認しました。
$ grafana-cli --version
Grafana CLI version 9.2.3