東洋経済オンラインの記事を参考にしました。
次のようなグラフを作成します。
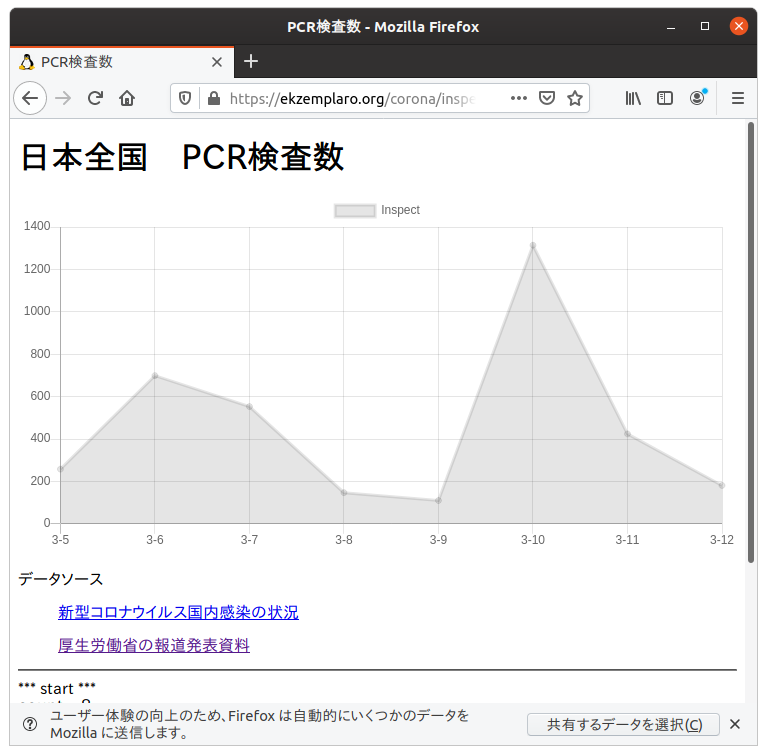
データソースは
新型コロナウイルス国内感染の状況
厚生労働省の報道発表資料
フォルダー構造
$ tree
.
├── data.json
├── index.html -> inspect.html
├── inspect.html
└── inspect.js
inspect.html
<!DOCTYPE html>
<html lang="ja">
<head>
<title>PCR検査数</title>
<meta charset="UTF-8">
<script src="/js/jquery-3.4.1.min.js"></script>
<script src="/js/Chart.min.js"></script>
<script src="inspect.js"></script>
</head>
<body>
<h1>日本全国 PCR検査数</h1>
<canvas id="chart" height="200" width="400"></canvas>
<p />
データソース<br />
<blockquote>
	<a href="https://toyokeizai.net/sp/visual/tko/covid19/">新型コロナウイルス国内感染の状況</a><p />
	<a href="https://www.mhlw.go.jp/stf/seisakunitsuite/bunya/0000121431_00086.html">厚生労働省の報道発表資料</a><p />
</blockquote>
<hr />
<div id="outarea_aa">outarea_aa</div>
<div id="outarea_bb">outarea_bb</div>
<div id="outarea_cc">outarea_cc</div>
<div id="outarea_dd">outarea_dd</div>
<div id="outarea_ee">outarea_ee</div>
<div id="outarea_ff">outarea_ff</div>
<div id="outarea_gg">outarea_gg</div>
<div id="outarea_hh">outarea_hh</div>
<hr />
Mar/12/2020<p />
</body>
</html>
inspect.js
// ----------------------------------------------------------------------
//	inspect.js
//
//					Mar/13/2020
// ----------------------------------------------------------------------
const file_json = "data.json"

jQuery.getJSON(file_json,function (data)
	{
	jQuery("#outarea_aa").text ("*** start ***")
	const graph_data = convert01(data)
	jQuery("#outarea_cc").text (graph_data.labels.toString())
	jQuery("#outarea_dd").text (graph_data.datasets[0].data.toString())
	prog01 (graph_data)
	jQuery("#outarea_hh").text ("*** end ***")
	})


// ----------------------------------------------------------------------
function convert01(data)
{
	var count = 0
	var labels = []
	var numbers = []
	var number_before = 0
	for (it in data.transition)
		{
		if (0 < it)
			{
			number_before = data.transition[it-1][3]
			}

		unit = data.transition[it]
		if ((2 < unit[0]) && (4 < unit[1]))
			{
			const label = String(unit[0]) + "-" + String(unit[1])
			labels.push(label)
			const number = unit[3] - number_before
			numbers.push(number)
			count += 1
			}
		}

	graph_data = {}

	graph_data['labels'] = labels
	graph_data['datasets'] = []

	const unit_aa =		{
		label: "Inspect",
		lineTension: 0,
		data : numbers
		}

	graph_data['datasets'].push(unit_aa)

	jQuery("#outarea_bb").text ("count = " + count)

	return graph_data
}

// ----------------------------------------------------------------------
function prog01 (graph_data)
{
	const config = {
		type: 'line',
		data: graph_data
		}

	const context = jQuery("#chart")
	const chart = new Chart(context,config)
}

// ----------------------------------------------------------------------
data.json の取得方法
wget https://toyokeizai.net/sp/visual/tko/covid19/data/data.json