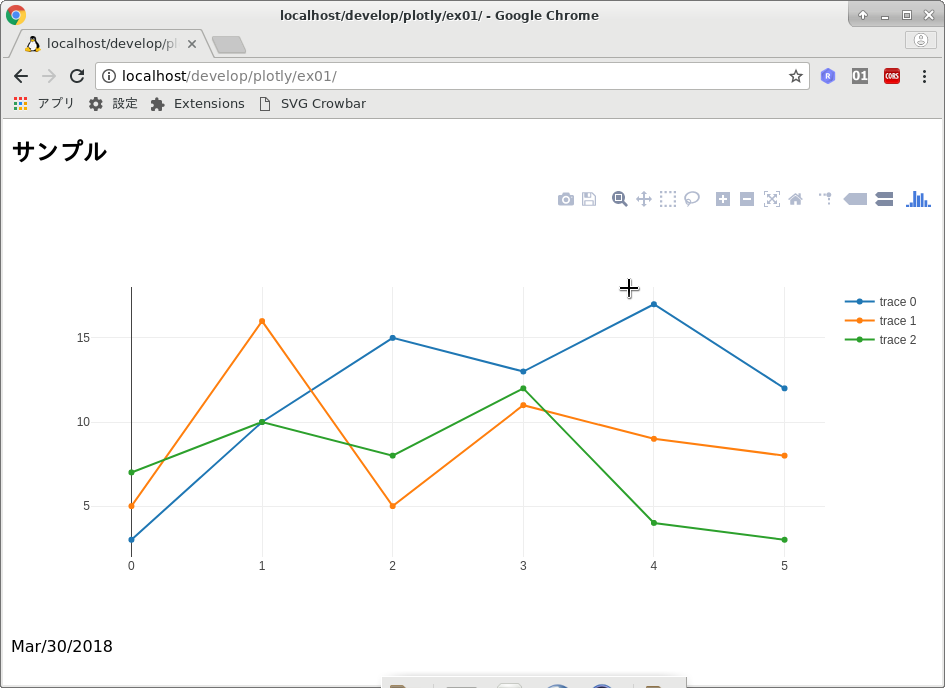
次のようなグラフを作成します。
index.html
<!DOCTYPE html>
<html lang="ja">
<head>
<meta http-equiv="CONTENT-TYPE" content="text/html; charset=utf-8" />
<!--
<script src="https://cdn.plot.ly/plotly-latest.min.js"></script>
-->
<script src="/js/plotly-latest.min.js"></script>
</head>

<body>
<h2>サンプル</h2>
<div id="myDiv"></div>
<script src="ex01.js"></script>
Mar/30/2018<p />
</body>
</html>
ex01.js
// ---------------------------------------------------------------
//  ex01.js
//
//                  Mar/30/2018
//
// ---------------------------------------------------------------
var trace1 = {
      x: [0,1,2,3,4,5],
      y: [3,10, 15, 13, 17,12],
      type: 'scatter'
}

var trace2 = {
      x: [0,1,2,3,4,5],
      y: [5,16, 5, 11, 9,8],
      type: 'scatter'
}

var trace3 = {
      x: [0,1,2,3,4,5],
      y: [7,10, 8, 12, 4,3],
      type: 'scatter'
}

var data = [trace1,trace2,trace3];

Plotly.newPlot('myDiv', data);

// ---------------------------------------------------------------