Web で閲覧できる次の地図を作成します。
フォルダーの構造です。
$ tree
.
├── index.html -> saitama_area.html
├── saitama.json
├── saitama_area.css
├── saitama_area.html
├── saitama_area.js
└── saitama_status.json
1) saitama.json の作り方
次から 埼玉県の地図情報をダウンロードします。
unzip N03-190101_11_GML.zip
ogr2ogr -f GeoJSON saitama.json N03-19_11_190101.shp
2) saitama_status.json の作り方
次のページのようにして、data_saitama.json を作成
次のページのようにして、code_cities.json を作成
./status_convert.py data_saitama.json code_cities.json saitama_status.json
status_convert.py
# ! /usr/bin/python
# -*- coding: utf-8 -*-
#
#	status_convert.py
#
#					Apr/03/2020
#
# ------------------------------------------------------------------
import	sys
import	os
import	json
from dateutil.parser import parse
#
# --------------------------------------------------------------------
def file_to_str_proc(file_in):
	str_out = ""
	try:
		fp_in = open(file_in,encoding='utf-8')
		str_out = fp_in.read()
		fp_in.close()
	except Exception as ee:
		sys.stderr.write("*** error *** file_to_str_proc ***\n")
		sys.stderr.write(str (ee))
#
	return	str_out
# --------------------------------------------------------------------
def file_write_proc(file_name,str_out):
#
	fp_out = open(file_name,mode='w',encoding='utf-8')
	fp_out.write(str_out)
	fp_out.close()
#
# ------------------------------------------------------------------
# [4]:
def add_data_proc(data_city,code,city,ddx,date_kijun):
	if code in data_city:
		data_city[code]["data"].append(date)
	else:
		data_city[code] = {"data": [date], "name": city,
				"status": 0, "count_a": 0, "count_b": 0}
#
	if (date_kijun[1] <= ddx):
		data_city[code]["status"] = 1
		data_city[code]["count_b"] += 1
	elif (date_kijun[0] <= ddx):
		data_city[code]["count_a"] += 1
#
	return data_city
# ------------------------------------------------------------------
# [6]:
def level_two_find_proc(data_city):
	for key in data_city:
		unit_aa = data_city[key]
		count_a = unit_aa["count_a"]
		count_b = unit_aa["count_b"]
		if count_a < count_b:
			unit_aa["status"] = 2
		print(key,unit_aa["name"],count_a,count_b,unit_aa["status"])
	return	data_city
# ------------------------------------------------------------------
sys.stderr.write("*** 開始 ***\n")
#
json_in = sys.argv[1]
json_code = sys.argv[2]
json_out = sys.argv[3]
sys.stderr.write(json_in + "\n")
sys.stderr.write(json_code + "\n")
sys.stderr.write(json_out + "\n")
#
str_data = file_to_str_proc(json_in)
str_code = file_to_str_proc(json_code)
#
dict_aa = json.loads(str_data)
city_code = json.loads(str_code)
#
data_city = {}
date_kijun = [parse("2020/3/17"), parse("2020/3/24")]
for key in dict_aa:
	code = "99999"
	unit_aa = dict_aa[key]
	city = unit_aa['place']
	date = unit_aa['date']
	ddx = parse(date)
	if city in city_code:
		code = city_code[city]['code']
#
	if (date_kijun[0] <= ddx):
#		print(city,code,date,ddx)
		data_city = add_data_proc(data_city,code,city,ddx,date_kijun)
#
data_city = level_two_find_proc(data_city)
out_str = json.dumps(data_city)
file_write_proc(json_out,out_str)
sys.stderr.write("*** 終了 ***\n")
# ------------------------------------------------------------------
ホームページ
saitama_area.html
<!DOCTYPE html>
<html lang="ja">
<head>
<meta http-equiv="Pragma" content="no-cache" />
<meta http-equiv="Cache-Control" content="no-cache" />
<meta http-equiv="CONTENT-TYPE" content="text/html; charset=utf-8" />
<link href="saitama_area.css" rel="stylesheet">
<script src="/js/jquery-3.4.1.min.js"></script>
<script src="/js/d3.v5.min.js"></script>
<script src="saitama_area.js"></script>
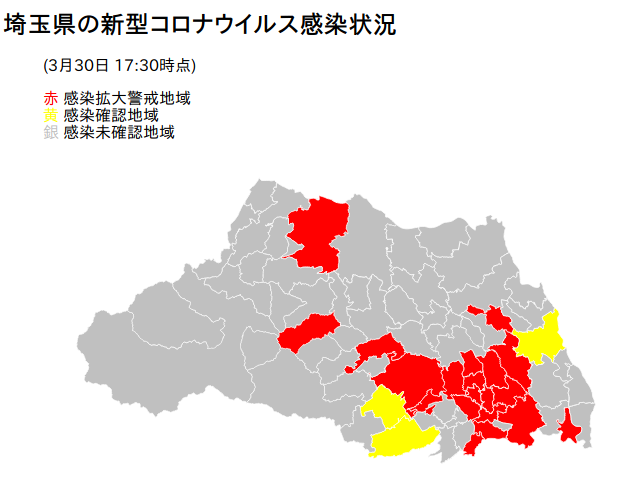
<title>埼玉県の新型コロナウイルス感染状況</title>
</head>
<body>
<h2>埼玉県の新型コロナウイルス感染状況</h2>
<blockquote>
(3月30日 17:30時点)<p />
<span class="red">赤</span> 感染拡大警戒地域<br />
<span class="yellow">黄</span> 感染確認地域<br />
<span class="silver">銀</span> 感染未確認地域<br />
</blockquote>
<svg id="map"></svg>
<p />
<blockquote>
3/24 から 3/30 の間に感染者が確認されたところは、黄または赤になる。<br />
3/24 から 3/30 の間の感染者数が前週より増加すれば、赤になる。<br />
</blockquote>
<hr />
<div id="outarea_aa">outarea_aa</div>
<div id="outarea_bb">outarea_bb</div>
<div id="outarea_cc">outarea_cc</div>
<div id="outarea_dd">outarea_dd</div>
<div id="outarea_ee">outarea_ee</div>
<div id="outarea_ff">outarea_ff</div>
<div id="outarea_gg">outarea_gg</div>
<div id="outarea_hh">outarea_hh</div>
<hr />
Apr/03/2020<p />
</body>
</html>
saitama_area.css
/* -------------------------------------------------------------- */
/*
	saitama_area.css

					Apr/03/2020
*/
/* -------------------------------------------------------------- */
.area {
    fill: silver;
    stroke: white;
}
.popup {
    fill: black;
    font-size: 10pt;
}

.red {color: red;}
.yellow {color: yellow;}
.silver {color: silver;}
.green {color: green;}
/* -------------------------------------------------------------- */
saitama_area.js
// ------------------------------------------------------------------------
//	saitama_area.js
//
//						Apr/03/2020
// ------------------------------------------------------------------------
const file_json = "saitama.json"
const file_status = "saitama_status.json"

jQuery.getJSON(file_json,function (data)
	{
	jQuery.getJSON(file_status,function (status_aa)
		{
		jQuery("#outarea_aa").text ("*** start ***")
		const status_bb = to_district_proc(status_aa)
		draw_map_proc(data,status_bb)
		jQuery("#outarea_hh").text ("*** end ***")
		})
	})

// ------------------------------------------------------------------------
// [4]:
function to_district_proc(status_in)
{
	var status_out = {}
	var str_out = ""

	for (var key in status_in)
		{
		const unit_aa = status_in[key]
		str_out += key + "<br />"

		if (key == "11100")
			{
			for (var it=1; it<= 10; it += 1)
				{
				const key_dd = "111" + ('00' + it).slice(-2)
				str_out += "key_dd = " + key_dd + "<br />"
				status_out[key_dd] = unit_aa
				}
			}
		else
			{
			status_out[key] = unit_aa
			}
		}

//	jQuery("#outarea_cc").html (str_out)

	return status_out
}

// ------------------------------------------------------------------------
// [6]:
function draw_map_proc(data_in,status_in)
{
	const WIDTH = 700
//	const HEIGHT = 560
	const HEIGHT = 350

	var svg = d3.selectAll("#map")
		.attr("width", WIDTH)
		.attr("height", HEIGHT);

	var gg = svg.append("g");

        var projection = d3.geoMercator()
            .scale(25000)
            .center(d3.geoCentroid(data_in))
            .translate([WIDTH / 2, HEIGHT / 2])

        var path = d3.geoPath()
            .projection(projection)

        gg.selectAll('path')
		.data(data_in.features)
		.enter()
		.append('path')
		.attr('d', path)
		.attr('class', 'area')
		.attr('name', function(d) {
			const pp = d.properties;
           		this.style.fill = add_color_proc(pp,status_in)
			return pp.N03_004;
			})
		.attr('key', function(d) {
			const pp = d.properties;
			return pp.N03_007
			})
/*
		.on('mouseover', function() {
                this.style.fill = 'red';
            })
            .on('mouseout', function() {
                this.style.fill = 'silver';
		})
*/
            .on('click', function() {
                this.style.fill = 'blue';
		const key = this.getAttribute('key')
		const name = this.getAttribute('name')
		var str_out = key + "<br />"
		str_out += name + "<br />"
		jQuery("#outarea_cc").html (str_out)
            })

}

// ------------------------------------------------------------------------
// [6-4]:
function add_color_proc(pp,status_in)
{
	var color = 'silver'

	const key = pp.N03_007

	if (key in status_in)
		{
		const status = status_in[key].status

		if (status == 2)
			color = 'red'
		else if (status == 1)
			color = 'yellow'
		else if (status == 0)
			color = 'silver'
		}

	return	color
}

// ------------------------------------------------------------------------