はじめに
2 つの Axes をいい感じに配置したグラフが例えば 4 個あり、それらを 2 x 2 のタイル状に並べたい。
MATLAB Answers にそんな問い合わせがありました。確かに簡単じゃないな、、と思いましたので1つの方法を解説します。(もっと簡単な方法あればアイデアください)
参照:MATLAB Answers: 2つ重なったグラフを複数、1つ図にまとめる。
環境
MATLAB R2020a
やったこと
2 つの axes をいい感じに配置したグラフを n*m 個作り、それらを n x m のタイル状に並べた。

こんな感じ。記事のポイントは
- axes オブジェクトの位置決め
- 'Position' と 'OuterPosition' の違い
-
subplotの機能
です。
もともとのグラフが個別に *.fig で保存されている場合の対処方法についてはまた別途。
やりたいことのイメージ図
例えばこんな 2 つセットの図を作ったとします。(2つ重ねる意義のあるデータがあればよかったのですが・・)
コード折りたたみ
close all
% Axes の位置調整
ax1 = axes('Position',[0.13, 0.50, 0.775, 0.35]);
ax2 = axes('Position',[0.13, 0.15, 0.775, 0.35]);

% サンプルデータ
N = 200;
t = linspace(0,1,N);
x = randn(1,N) + sin(2*pi*120*t);

% プロット
plot(ax1, x)
plot(ax2, abs(fft(x)))

% 座標軸は消しちゃおう
ax1.XTickLabel = [];
ax1.YTickLabel = [];
ax2.XTickLabel = [];
ax2.YTickLabel = [];
title(ax1,'時系列データ x')
title(ax2,'abs(fft(x))')

これを 1 セットとして、4 セットを 2 x 2 のタイル状に並べたい。少しヤヤコシイので丁寧に解説してみます。
subplot じゃダメなの?
1 つのグラフをタイル状に並べるだけなら簡単です。
お馴染みの subplot や最近だと tiledlayout というものもあります。subplot を使った例としてはこちらも参照:このプロットどうやって描いたの?:複数プロット、アニメーション編
subplot(1,2,1)
plot(rand(10,1),'r')
subplot(1,2,2)
plot(rand(10,1),'b')

簡単ですね。
ただタイル 1つ分(上の赤い線が表示されている部分)に 2 つの axes で構成されるプロットを載せるのは subplot でだと直感的にはできません。
なぜなら subplot はただ単に Figure 上にいい感じに配置された axes オブジェクトを作る関数なので、複数の axes オブジェクト位置の微調整には向いていません。
残された選択肢は、上で紹介した
ax1 = axes('Position',[0.13, 0.50, 0.775, 0.35]);
ax2 = axes('Position',[0.13, 0.15, 0.775, 0.35]);
のように1つ1つの axes 位置をマニュアルで指定する方法だが、、全部に対してこれはやりたくないですね。
じゃぁどうするか?
ここでは subplot がタイル状にいい感じに配置してくれた配置情報を利用して、それぞれのタイル内に axes を 2 つを配置する作業を試してみることにする。
axes オブジェクトの位置確認:OuterPosition
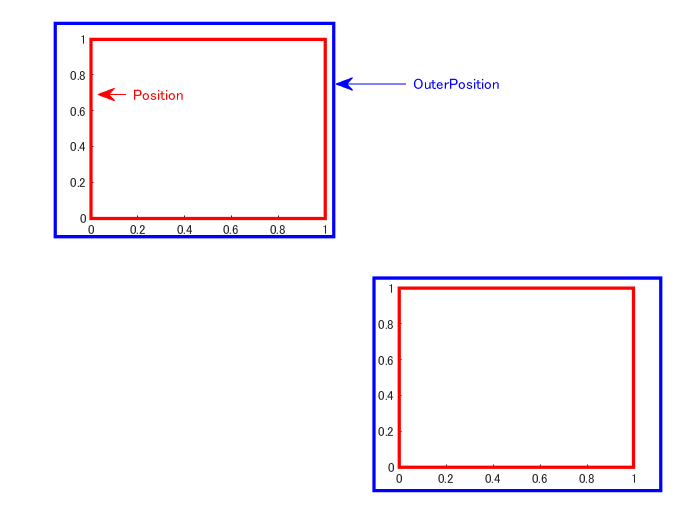
subplot が作る axes オブジェクトの位置情報としては 'OuterPosition' プロパティが良いと思われます。
'Position' プロパティの方が登場すると思いますが、以下の図の通りこれは座標軸自体(データの表示範囲)の大きさなので axes オブジェクトそのものの大きさより一回り小さい点に注意が必要です。
2 x 2 の配置で 'OuterPosition' と 'Position' の位置を可視化してみました。
コード折りたたみ
h_fig = figure(1);
h_axes1 = subplot(2,2,1);
outer1 = h_axes1.OuterPosition;
annotation(h_fig, 'rectangle', outer1,'LineWidth',2,'Color','blue');
inner1 = h_axes1.Position;
annotation(h_fig, 'rectangle', inner1,'LineWidth',2,'Color','red');

h_axes4 = subplot(2,2,4);
outer4 = h_axes4.OuterPosition;
annotation(h_fig, 'rectangle', outer4,'LineWidth',2,'Color','blue');
inner4 = h_axes4.Position;
annotation(h_fig, 'rectangle', inner4,'LineWidth',2,'Color','red');

annotation('textarrow',[0.58 0.48],[0.84 0.84],'String','OuterPosition','Color','blue')
annotation('textarrow',[0.18 0.14],[0.82 0.82],'String','Position','Color','red')

これは 2 つだけ表示していますが、同じように
subplot(2,2,2)
subplot(2,2,3)
と加えれば 2 x 2 の配置で axes が 4 つ作られます。
OuterPosition 内での位置決め
次は青枠の中('OuterPosition' 内)に冒頭で表示した 2 つの axes を組み合わせた図を入れてみます。冒頭で示したように 'Position' を 4 つの数値で定義します。
例:
ax1 = axes('Position',[0.13, 0.50, 0.775, 0.35]);
ax2 = axes('Position',[0.13, 0.15, 0.775, 0.35]);
これは Figure の縦横の長さをそれぞれ 1 と考えて、[x,y,width,hight] の順に並んでいます。
- x: 左下端の x 座標
- y: 左下端の y 座標
- width: 横幅
- height: 縦幅
です。
ややこしいところとしては、この数値はあくまでFigure 全体における位置情報で指定する必要があること。
Figure 上と同じ相対位置関係で OuterPosition 内に配置しようとすると、**「OuterPosition 内での相対位置」から「Figure 全体での絶対位置」**に変換する処理が必要です。
例えば 'OuterPosition' の縦横の長さをそれぞれ 1 と考えて
r1 = [0.13, 0.50, 0.775, 0.35];
r2 = [0.13, 0.15, 0.775, 0.35];
という配置で 2 つの axes を、1 つの subplot 枠内に設置したいとします。
コード折りたたみ
h_fig = figure(2);
h_axes1 = subplot(2,1,1);
h_axes2 = subplot(2,1,2);

% 1 つ目subplot の位置情報
pos = h_axes1.OuterPosition;
% 青色で可視化
annotation(h_fig, 'rectangle', pos,'LineWidth',2,'Color','blue');
annotation(h_fig, 'rectangle', h_axes2.OuterPosition,'LineWidth',2,'Color','blue');

% subplot が作った axes は削除
delete(h_axes1)
delete(h_axes2)

% OuterPosition から Figure 上での配置に変換
width = pos(3);
height = pos(4);

% r1 = [0.13, 0.50, 0.775, 0.35];
xInit1 = pos(1) + width*r1(1);
xWidth1 = width*r1(3);
yInit1 = pos(2) + height*r1(2);
yHeight1 = height*r1(4);

% r2 = [0.13, 0.15, 0.775, 0.35];
xInit2 = pos(1) + width*r2(1);
xWidth2 = width*r2(3);
yInit2 = pos(2) + height*r2(2);
yHeight2 = height*r2(4);

% 2 つ axes を作成して
ax1 = axes('Position',[xInit1, yInit1, xWidth1, yHeight1]);
ax2 = axes('Position',[xInit2, yInit2, xWidth2, yHeight2]);

% プロット
N = 100;
t = linspace(0,1,N);
x = randn(1,N) + sin(2*pi*120*t);
plot(ax1, x)
plot(ax2, abs(fft(x)))

% 座標軸は消しちゃおう
ax1.XTickLabel = [];
ax1.YTickLabel = [];
ax2.XTickLabel = [];
ax2.YTickLabel = [];
title(ax1,'時系列データ x')
title(ax2,'abs(fft(x))')

こんな具合。参考までに 2 つの 'OuterPosition' の位置を青枠で表示しています。
使ってみた
あとはどう使うか次第ですが‥例えば以下のように subplot の拡張版風に axes オブジェクトを返す関数(drawTwoAxesPlot.m)にしても良いかもしれない。
以下は 2 x 3 の配置ですが以下のやり方任意の数設置できるはず。
figure
for ii=1:6

    % subplot 内に 2 つ axes 作成
    [ax1,ax2] = drawTwoAxesPlot(2,3,ii);

    % 各 axes 内にプロット
    N = 100;
    t = linspace(0,1,N);
    x = randn(1,N) + sin(2*pi*120*t);
    plot(ax1, x)
    plot(ax2, abs(fft(x)))

    % 座標軸は消しちゃおう
    ax1.XTickLabel = [];
    ax1.YTickLabel = [];
    ax2.XTickLabel = [];
    ax2.YTickLabel = [];
    title(ax1,'時系列データ x')
    title(ax2,'abs(fft(x))')
end

まとめ
結局のところ全 axes の 'Position' を明示的に指定しているんですが、subplot 関数も使って工数は削減できているかなと思います。
ここで紹介したやり方を使って、もともとのグラフが個別に *.fig で保存されている場合の対処方法についてはまた別途纏めます。
コメント・改善点・もっと良い方法などありましたらコメントください。
Appendix: drawTwoAxesPlot 関数
function [ax1, ax2] = drawTwoAxesPlot(n,m,p)
    h = subplot(n,m,p);

    % この例だと 'OuterPosition' の枠内での相対位置は
    % 固定としています。
    r1 = [0.13, 0.50, 0.775, 0.35];
    r2 = [0.13, 0.15, 0.775, 0.35];

    pos = h.OuterPosition;
    width = pos(3);
    height = pos(4);

    % r1 = [0.13, 0.50, 0.775, 0.35];
    xInit1 = pos(1) + width*r1(1);
    xWidth1 = width*r1(3);
    yInit1 = pos(2) + height*r1(2);
    yHeight1 = height*r1(4);

    % r2 = [0.13, 0.15, 0.775, 0.35];
    xInit2 = pos(1) + width*r2(1);
    xWidth2 = width*r2(3);
    yInit2 = pos(2) + height*r2(2);
    yHeight2 = height*r2(4);

    % axes 作成
    ax1 = axes('Position',[xInit1, yInit1, xWidth1, yHeight1]);
    ax2 = axes('Position',[xInit2, yInit2, xWidth2, yHeight2]);

    % subplot が作った axes は削除
    delete(h)
end