はじめに
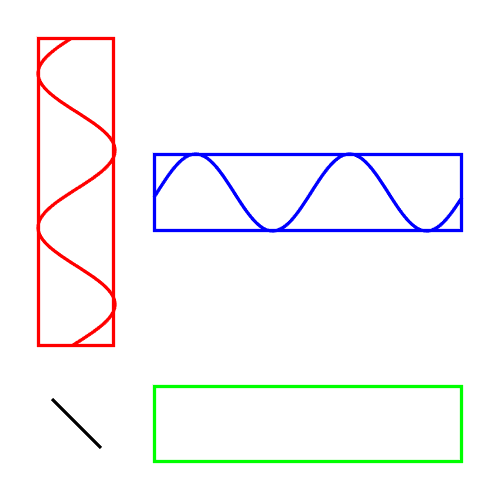
こちら(Wikipedia:位相変調)で表示されている位相変調の図。

これを MATLAB で描ける?そんな幻聴が聞こえてきた気がしたのでやってみました。
コードはこちら:https://github.com/minoue-xx/Visualize-Phase-Modulation-with-MATLAB
この記事は livescript2markdown で Live script を半自動変換した markdown で投稿しています。もとの Live script も GitHub に置いてあるので興味のある方は DL して実行してみてください。
記事のポイント
4 つの Axes オブジェクトの配置や色付け、そしてそれぞれの Axes オブジェクトの点同士をつなぐ作業、Annotation オブジェクトの配置など・・基本要素が盛りだくさん。少し長いですが作成の過程を纏めました。
見どころは plot 関数の落とし穴と line 関数でのカバーでしょうか・・読んだ後は、MATLAB のグラフィックスオブジェクトに対するハードルはぐっと下がるはず。
まずはいろんな確認から
動くサインカーブ
とりあえず 2 波長分、0 から 4$\pi$までサイン波を書いてみます。
N = 100;
t0 = linspace(0,4*pi,N);
y = sin(t0);
handle_line = plot(t0,y);

この波形をぬめぬめ動かすには・・座標軸は固定した上で t を少しづつ大きくしてみます。
まずは座標軸の handle を確保して座標軸を固定。
handle_axes = gca;
handle_axes.XLim = [0,4*pi];
そして for ループで y の値を変えていきます。
dt = 4*pi/N;
for ii=1:N % 2波長分描きます。
    t = t0 + dt*(ii-1);
    y = sin(t);
    handle_line.YData = y;
    drawnow
end

できた。注:この GIF は animateSimpleSineCurve.m (GitHub)で作っています。
x 軸の値が固定という点がなんとなく気持ち悪いですが、これで行きます。
Axes オブジェクトの枠
プロットの枠もいい感じにしていきます。 Axes オブジェクトのプロパティ に何があるのか確認しながら進めます。
まずは軸ラベル
これは簡単、XTick と YTick プロパティーを消しちゃえばOK。線も太くしたいので、LineWidth も触っておきます。
handle_axes.XTick = [];
handle_axes.YTick = [];
handle_axes.LineWidth = 2;

いい感じ。
枠の色
あと枠の色も変えたいときには・・XColor、YColor プロパティでした。とりあえず赤にしてみます。ちなみに Color プロパティは背景色。ついでにサイン派も赤く・太くしておきます。
handle_axes.XColor = 'red';
handle_axes.YColor = 'red';
handle_line.Color = 'red';
handle_line.LineWidth = 2;

これで基本は完成。
Axes オブジェクトの配置
さて、4 つの座標軸を配置します。
前回(このプロットどうやって描いたの?:複数プロット、アニメーション編)は subplot 関数を使いましたが、ちょいと配置が複雑そう。こういうときは Axes オブジェクトの Position プロパティを直接設定してしまいましょう。そもそも subplot 関数はその作業をちょっと楽にしているだけですし。

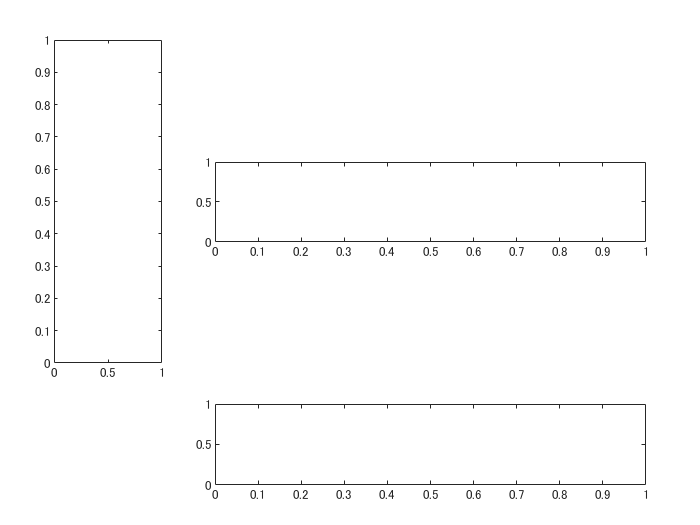
こんな Figure 上の構成で行きます。
Axes の Position プロパティは、左下端の Figure 上での位置と、幅と高さを指定する 4 要素で成り立っていますのでこんな感じ。
handle_fig = figure;
handle_axesA = axes(handle_fig,'Position',[1,1,2,2]/13);
handle_axesB = axes(handle_fig,'Position',[4,1,8,2]/13);
handle_axesC = axes(handle_fig,'Position',[1,4,2,8]/13);
handle_axesD = axes(handle_fig,'Position',[4,7,8,2]/13);

あれ、枠が下と左にしかない。
これは Box プロパティ('on' / 'off')です。全部 'on' にしましょう。
handle_axesA.Box = 'on';
handle_axesB.Box = 'on';
handle_axesC.Box = 'on';
handle_axesD.Box = 'on';

Figure 上に Axes が 1 つだと勝手に 'on' 、2 つ以上だと 'off' になる設定なんでしょうかね。
余談:枠を消す方法
ん?そういえば、枠を消すにはどうするんだと?
調べたところ、MATLAB Answers にこんな投稿がありました:How do I remove the border lines surrounding an axes?
要は枠の色を背景色、もしくは 'none' と設定すればOKとのこと。
handle_axesA.XColor = 'none';
handle_axesA.YColor = 'none';

消えました・・・。
いったんまとめ
ここまでで確認できたことをまとめると・・
- 動く波の描画
- Axes オブジェクト:枠の色設定、軸ラベルの消し方
- 4 つの Axes オブジェクト設置、枠の消し方
ということで、全部組み合わせます。
枠設定は繰り返しが多いので関数化します。
function handle_axes = setUpAxes(handle_fig, Position, color)
    handle_axes = axes(handle_fig,'Position',Position,'Box',"on");
    handle_axes.XColor = color;
    handle_axes.YColor = color;
    handle_axes.XTick = [];
    handle_axes.YTick = [];
    handle_axes.LineWidth = 2;
end
addpath('.\function')
handle_fig = figure('Position',[100,100,400,400]);
handle_axesA = setUpAxes(handle_fig,[1,1,2,2]/13,'none');
handle_axesB = setUpAxes(handle_fig,[4,1,8,2]/13,'green');
handle_axesC = setUpAxes(handle_fig,[1,4,2,8]/13,'red');
handle_axesD = setUpAxes(handle_fig,[4,7,8,2]/13,'blue');
Axes C(赤)と Axes D(青)にサイン波を追加します。
N = 100;
t0 = linspace(0,4*pi,N);
y = pi/2*sin(t0); % 振幅は pi/2
handle_lineC = plot(handle_axesC,y,t0); % Axes C は縦向き
handle_lineD = plot(handle_axesD,t0,y);
handle_axesC.YLim = [0,4*pi]; % Axes C は縦向き
handle_axesD.XLim = [0,4*pi];

あ、せっかくの設定が・・
そう plot 関数ってこういうところあるんですよね。親切心なんでしょうが、事前設定をリセットしちゃう。こんな時にはただ従順に線を書く line 関数にしましょう。
line 関数でやりなおし。色を Axes と同じに、そして線も太くしておきます。
枠が消えちゃっている Axes A にも線を追加します。
handle_fig = figure('Position',[100,100,400,400]);
handle_axesA = setUpAxes(handle_fig,[1,1,2,2]/13,'none');
handle_axesB = setUpAxes(handle_fig,[4,1,8,2]/13,'green');
handle_axesC = setUpAxes(handle_fig,[1,4,2,8]/13,'red');
handle_axesD = setUpAxes(handle_fig,[4,7,8,2]/13,'blue');

handle_axesA.XLim = [-pi/2,pi/2];
handle_axesA.YLim = [-pi/2,pi/2];
handle_axesB.XLim = [0,4*pi];
handle_axesB.YLim = [-pi/2,pi/2];
handle_axesC.XLim = [-pi/2,pi/2]; % Axes C は縦向き
handle_axesC.YLim = [0,4*pi]; % Axes C は縦向き
handle_axesD.XLim = [0,4*pi];
handle_axesD.YLim = [-pi/2,pi/2];

N = 100;
t0 = linspace(0,4*pi,N);
y = sin(t0);
handle_lineC = line(handle_axesC,y,t0,'Color','red','LineWidth',2); % Axes C は縦向き
handle_lineD = line(handle_axesD,t0,y,'Color','blue','LineWidth',2);
handle_lineA = line(handle_axesA, [-1,1],[1,-1],'Color','black','LineWidth',2);

dt = 4*pi/N;
for ii=1:N % 2波長分描きます。
    t = t0 + dt*(ii-1);
    y = pi/2*sin(t);
    handle_lineC.XData = y; % Axes C は縦向き
    handle_lineD.YData = y;
    drawnow
end

形になってきました。
あとは?
- 各プロットで動いている点
- それぞれを結ぶ線
ですね。やっていきましょう。
Axes 間をまたぐ線
これは annotation 関数で描きます。
ただこちらの記事(MATLABのプロットでアノテーションをつける)でも触れているように、annotation オブジェクトは Figure 内での位置を指定する必要があります。結ぶべき動く点は Axes 上で定義されるデータ値なので、この変換が手間ですが避けられません。
ここは関数を作って乗り越えましょう。
function [xFig,yFig] = axesPosition2figurePosition(data,handle_axes)

    x = data(1);
    y = data(2);
    handle_axes.Units = 'normalize';
    axesPos = handle_axes.Position;
    %  axesPos(1): x position of axes in figure
    %  axesPos(2): y position of axes in figure
    %  axesPos(3): width of axes in figure scale
    %  axesPos(4): height of axes in figure scale
    widthData = handle_axes.XLim(2)-handle_axes.XLim(1);
    heightData = handle_axes.YLim(2)-handle_axes.YLim(1);
    xmin = handle_axes.XLim(1);
    ymin = handle_axes.YLim(1);

    xFig = (x-xmin)/widthData*axesPos(3) + axesPos(1);
    yFig = (y-ymin)/heightData*axesPos(4) + axesPos(2);

end
入力は Axes 上のデータ値と Axes オブジェクト。Axes オブジェクトの表示範囲(XLim, YLim)と Figure 上での位置(Position)の情報をもとに、データ値を Figure 上での相対位置 (x,y) に変換します。
例えば
[xAfig,yAfig] = axesPosition2figurePosition([xA,yA],handle_axesA);
こんな感じで使います。
使用例
実際に使ってみます。まずは何でもいいので 2 つプロットを描きます。subplot 関数使います。
addpath("function");
handle_axes1 = subplot(2,1,1);
plot(rand(10,1));
handle_axes2 = subplot(2,1,2);
plot(rand(10,1));

そして上のグラフの (x,y) = (2,0.5) から 下のグラフの (x,y) = (8,0.5) まで線を引いてみます。
[xFig1,yFig1] = axesPosition2figurePosition([2,0.5],handle_axes1);
[xFig2,yFig2] = axesPosition2figurePosition([8,0.5],handle_axes2);
annotation("arrow",[xFig1,xFig2],[yFig1,yFig2])

こんな具合です。
各プロットで動いている点
それぞれのプロットで動いている点を描いて、上の方法でつないでみます。ついでに Axes B でどんどん伸びてくる線も書いておきます。
ちょっと長いので折りたたんでます
clear
close all
% Figure の上で Axes 作成
handle_fig = figure('Position',[100,100,400,400],'Color','w');
handle_axesA = setUpAxes(handle_fig,[1,1,2,2]/13,'none');
handle_axesB = setUpAxes(handle_fig,[4,1,8,2]/13,'green');
handle_axesC = setUpAxes(handle_fig,[1,4,2,8]/13,'red');
handle_axesD = setUpAxes(handle_fig,[4,7,8,2]/13,'blue');

% それぞれの Axes 表示範囲を固定
handle_axesA.XLim = [-pi/2,pi/2];
handle_axesA.YLim = [-pi/2,pi/2];
handle_axesB.XLim = [0,4*pi];
handle_axesB.YLim = [-pi/2,pi/2];
handle_axesC.XLim = [-pi/2,pi/2]; % Axes C は縦向き
handle_axesC.YLim = [0,4*pi]; % Axes C は縦向き
handle_axesD.XLim = [0,4*pi];
handle_axesD.YLim = [-pi/2,pi/2];

% Axes A の y = -x の線を描く
handle_lineA = line(handle_axesA, [-pi/2,pi/2],[pi/2,-pi/2],'Color','black','LineWidth',2);

% Axes C, Axes D のサインカーブ
N = 100;
t0 = linspace(0,4*pi,N);
y = pi/2*sin(t0);
handle_lineC = line(handle_axesC,y,t0,'Color','red','LineWidth',2); % Axes C は縦向き
handle_lineD = line(handle_axesD,t0,y,'Color','blue','LineWidth',2);

% 動く点座標を描画
tC = 2*pi+y(1); % y position in C axes
xC = pi/2*sin(tC); % x position in C axes
handle_pointA = line(handle_axesA,xC,-xC,'Marker','o','MarkerFaceColor','black');
handle_pointB = line(handle_axesB,0,-xC,'Marker','o','MarkerFaceColor','green');
handle_pointC = line(handle_axesC,xC,tC,'Marker','o','MarkerFaceColor','red');
handle_pointD = line(handle_axesD,0,y(1),'Marker','o','MarkerFaceColor','blue');

% Axes B に新たな線を追加(時間経過とともに伸びます)
handle_lineB = line(handle_axesB,0,-xC,'Color','green','LineWidth',2);

% 式表示
handle_axesB.Title.Interpreter = 'latex';
handle_axesB.Title.FontSize = 15;
handle_axesB.Title.String = "$$\frac{\pi}{2}\sin\left(" + ...
    "t + \frac{\pi}{2} \sin \left( t \right) \right)$$";

% 動く点を結ぶ線を描きます。
% Figure 座標系に変換
[xAfig,yAfig] = axesPosition2figurePosition([xC,-xC],handle_axesA);
[xBfig,yBfig] = axesPosition2figurePosition([0,-xC],handle_axesB);
[xCfig,yCfig] = axesPosition2figurePosition([xC,tC],handle_axesC);
[xDfig,yDfig] = axesPosition2figurePosition([0,y(1)],handle_axesD);
% まず A <-> B
handle_annAB = annotation('line',[xAfig,xBfig],[yAfig,yBfig],'Color','green');
handle_annAC = annotation('line',[xAfig,xCfig],[yAfig,yCfig],'Color','red');
handle_annCD = annotation('line',[xCfig,xDfig],[yCfig,yDfig],'Color','blue');

できた。
あとはデータを更新して動かすだけ!
ここもまぁまぁ長いので折りたたんでます
dt = 4*pi/N;
for ii=1:N % 2波長分描きます。
    t = t0 + dt*ii;
    y = pi/2*sin(t);

    % Axes C, Axes D のサインカーブ
    handle_lineC.XData = y; % Axes C は縦向き
    handle_lineD.YData = y;

    % 動く点座標を描画
    tC = 2*pi+y(1); % y position in C axes
    xC = pi/2*sin(tC+dt*ii); % x position in C axes
    handle_pointA.XData = xC;
    handle_pointA.YData = -xC;
    handle_pointB.YData = -xC;
    handle_pointC.XData = xC;
    handle_pointC.YData = tC;
    handle_pointD.YData = y(1);

    % Axes B にデータ追加(線を伸ばす)
    handle_lineB.XData = [dt*ii,handle_lineB.XData];
    handle_lineB.YData = [handle_lineB.YData,-xC];

    % 動く点を結ぶ線を描きます。
    % Figure 座標系に変換
    [xAfig,yAfig] = axesPosition2figurePosition([xC,-xC],handle_axesA);
    [xBfig,yBfig] = axesPosition2figurePosition([0,-xC],handle_axesB);
    [xCfig,yCfig] = axesPosition2figurePosition([xC,tC],handle_axesC);
    [xDfig,yDfig] = axesPosition2figurePosition([0,y(1)],handle_axesD);
    % まず A <-> B
    handle_annAB.X = [xAfig,xBfig];
    handle_annAB.Y = [yAfig,yBfig];
    handle_annAC.X = [xAfig,xCfig];
    handle_annAC.Y = [yAfig,yCfig];
    handle_annCD.X = [xCfig,xDfig];
    handle_annCD.Y = [yCfig,yDfig];
    drawnow
end
で OK. オブジェクトの数だけ(しかも X 座標と Y 座標それぞれに 1 行)行数が増えてしまうのはちょっと美しくないですが・・。
仕上げ
ここまでは 搬送波(Axes C)と 伝送信号(Axes D)の周波数が同じですが、いろいろ遊べるようにここを可変にして関数化しちゃいましょう。GIF ファイルを生成するコマンドも入れておきます。
あと少し見栄え面では y = 0 のところに線が欲しい気がします。
handle_axesB.YTick = 0;
handle_axesC.XTick = 0; % Axes C は縦向き
handle_axesC.YTick = 2*pi; % 真ん中(y = 2pi を t = 0 と表示)
handle_axesC.YTickLabel = "t = 0"; % 真ん中(y = 2pi を t = 0 と表示)
handle_axesD.YTick = 0;
grid(handle_axesB,'on');
grid(handle_axesC,'on');
grid(handle_axesD,'on');
こんな感じで追加します。関数 plotPhaseModulation.m (GitHub)に盛り込みました。
以下を実行すればできあがり!
fC = 5;
fD = 2;
addpath('..\function\');
plotPhaseModulation(fC,fD);

以下のように第三引数にファイル名を入れると GIF 動画作ります。
% plotPhaseModulation(fC,fD,'output.gif');
注:R2019b Update 2 では Live Script 上で実行するとエラーがでます。原因は分かりませんが、getFrame で Figure 画面をキャプチャすると、グラフィックスオブジェクトの一部に影響が出ている様子。ごちゃごちゃしすぎたか。ですので、コマンドラインで実行してください・・。
まとめ
結構手間かかりましたが、無事に位相変調できました。。
今回の要素をカバーしていれば大体の図はかけちゃうんじゃないか?と思ってしまうような(自己)満足感です。
他にも、これ描いてみて!というようなカッコいい図があればコメントください1。
-
できるだけ頑張ります。 ↩