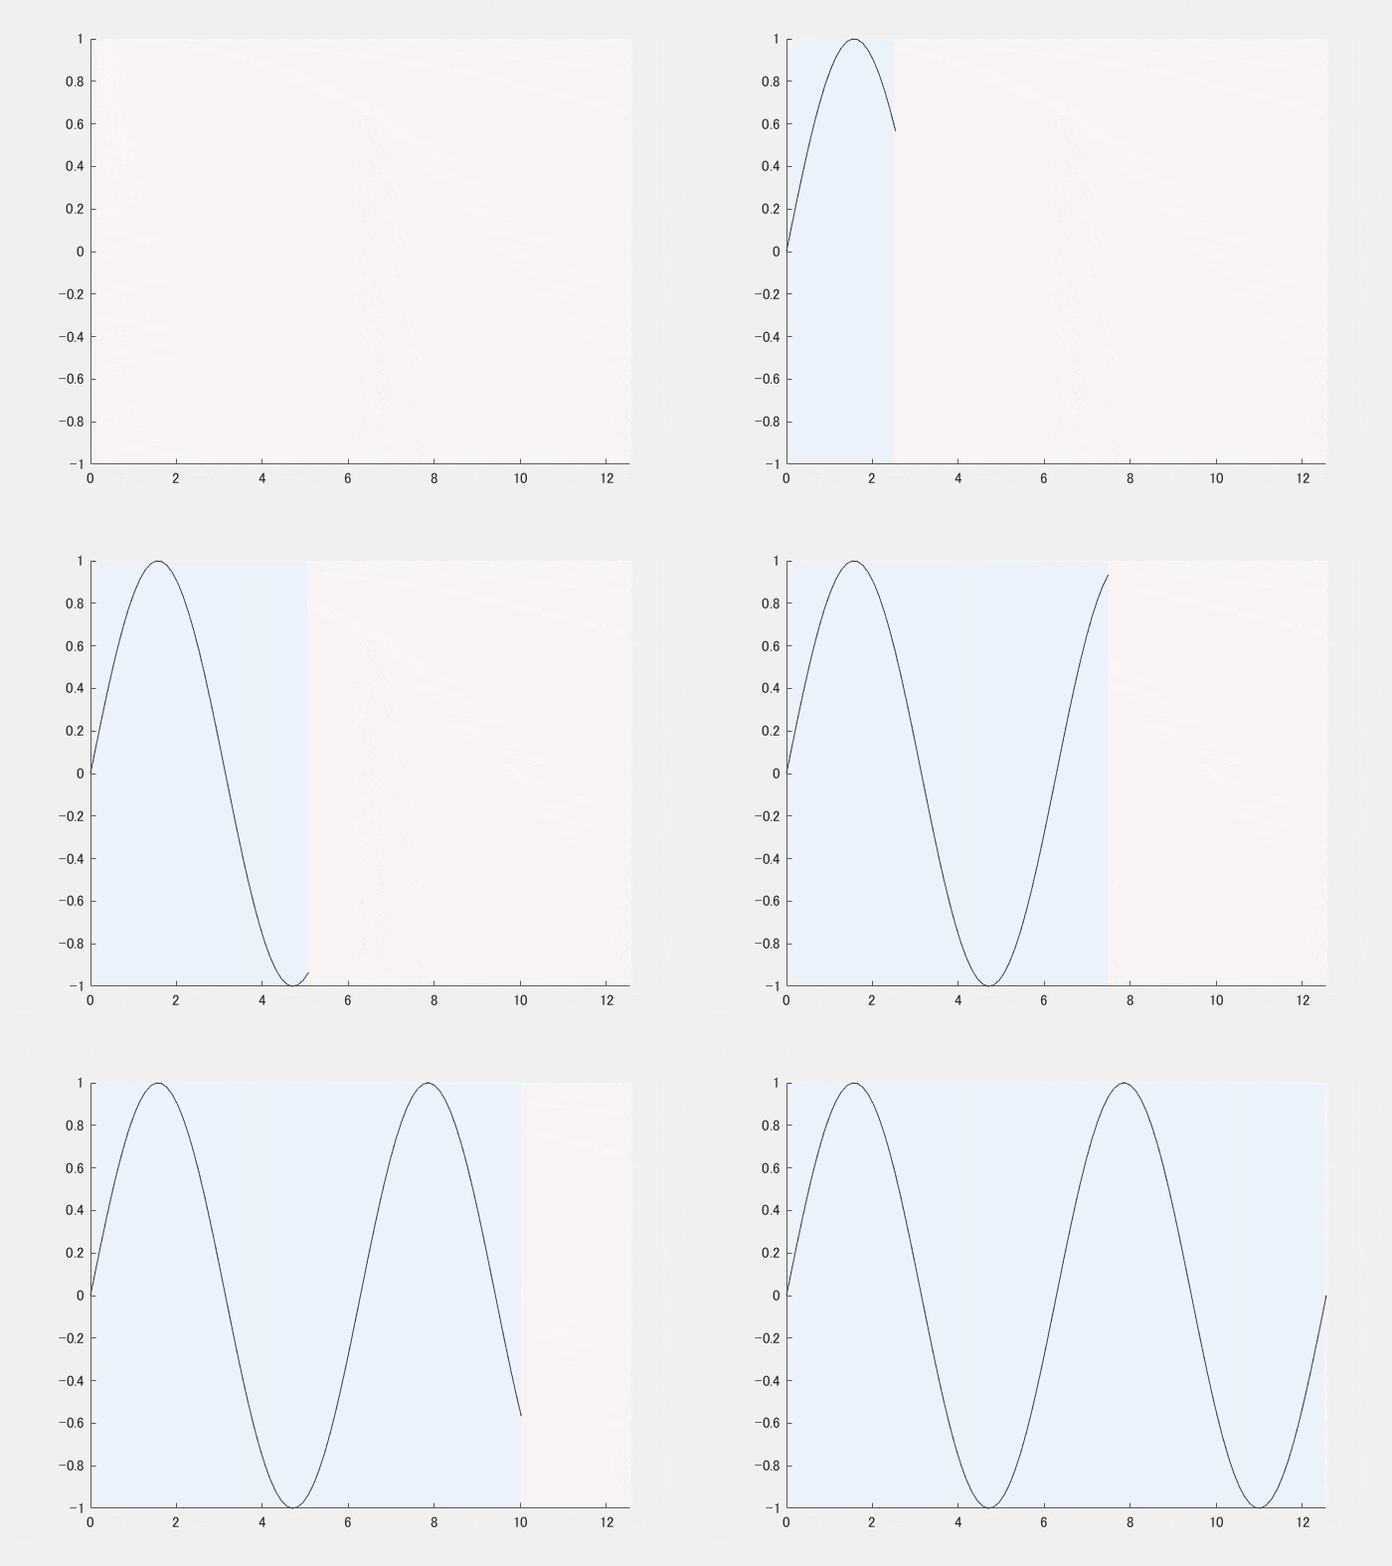
やったこと
2023/03/22 追記
R2023a で追加された機能でシンプルに書く方法を記載しました。
「グラフ背景色をデータの追加とともに変化させるアニメーション作成」を R2023a でシンプルに
その他の方法についてもこちらで紹介しています。
グラフ背景色の追加方法比較(area, rectangle, annotation, xregion)
追記終わり
- データに合わせた動的な背景描画
- gif ファイル作成
目次
- はじめに
- アニメーション(gif 作成)
- 背景の追加
- 背景追加+更新を行う関数作成
- そして最終形
はじめに
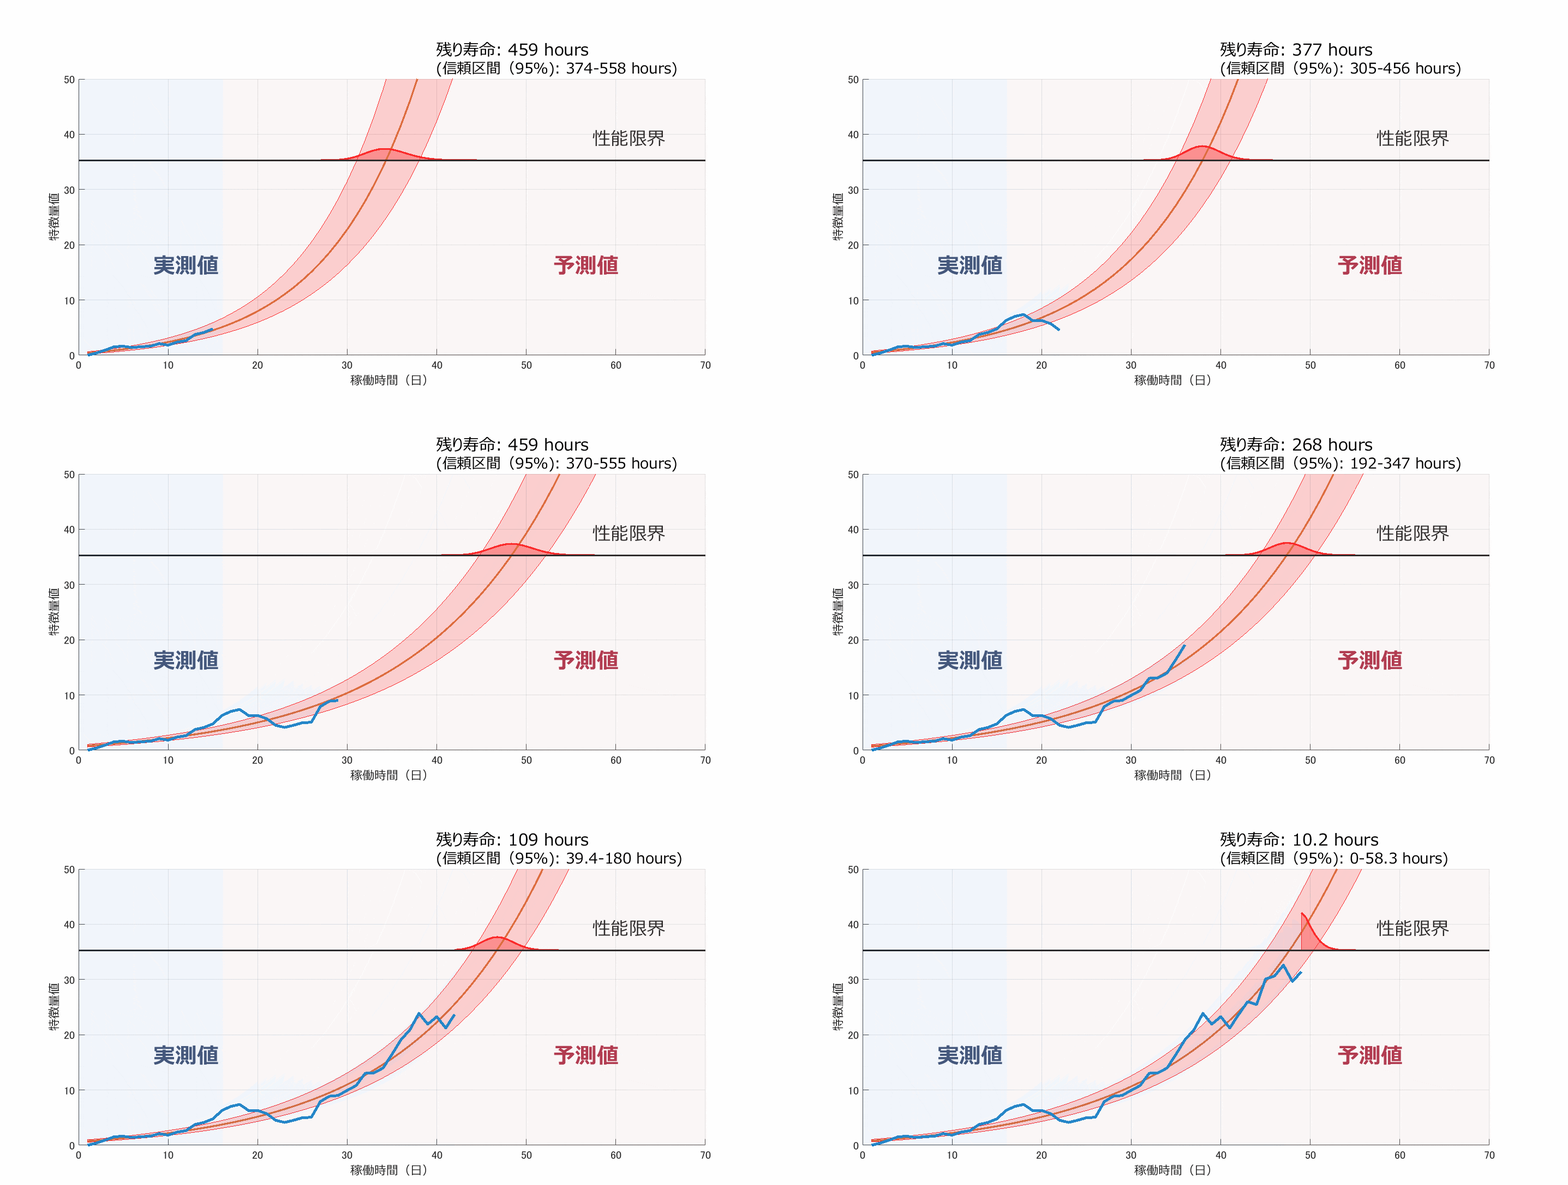
仕事柄こんなグラフを書くことがありました。
ある値が閾値(性能限界)を超えるまでの時間を予測したもの。線上を動く山はその確率分布です。予測の手法詳細ついてはこちら:
Residual-life distributions from component degradation signals: A Bayesian approach (N Gebraeel, 2005)
予測モデル自体は関数が実装されているので楽だったんですが、手間がかかったのは(苦笑) 個人的にお気に入りなのは、青い線ともに変化する、薄い赤青の背景。
値の推移をわかりやすくするとか、データ可視化の活用の幅が広がりそうなので備忘録的に解説します。
MATLAB のグラフィックスオブジェクト周りの知識が必要ですが、その辺は以下のページがお勧め。
参考:
Qiita: MATLAB でゲームを作る ~0. グラフィックス オブジェクト編~
公式ページ:グラフィックス オブジェクト
環境
MATLAB R2019a (R2014b以降なら動くはず)
以降、アニメーション作成と、背景描画に分けて紹介します。
それぞれのコードは独立に動くはず。
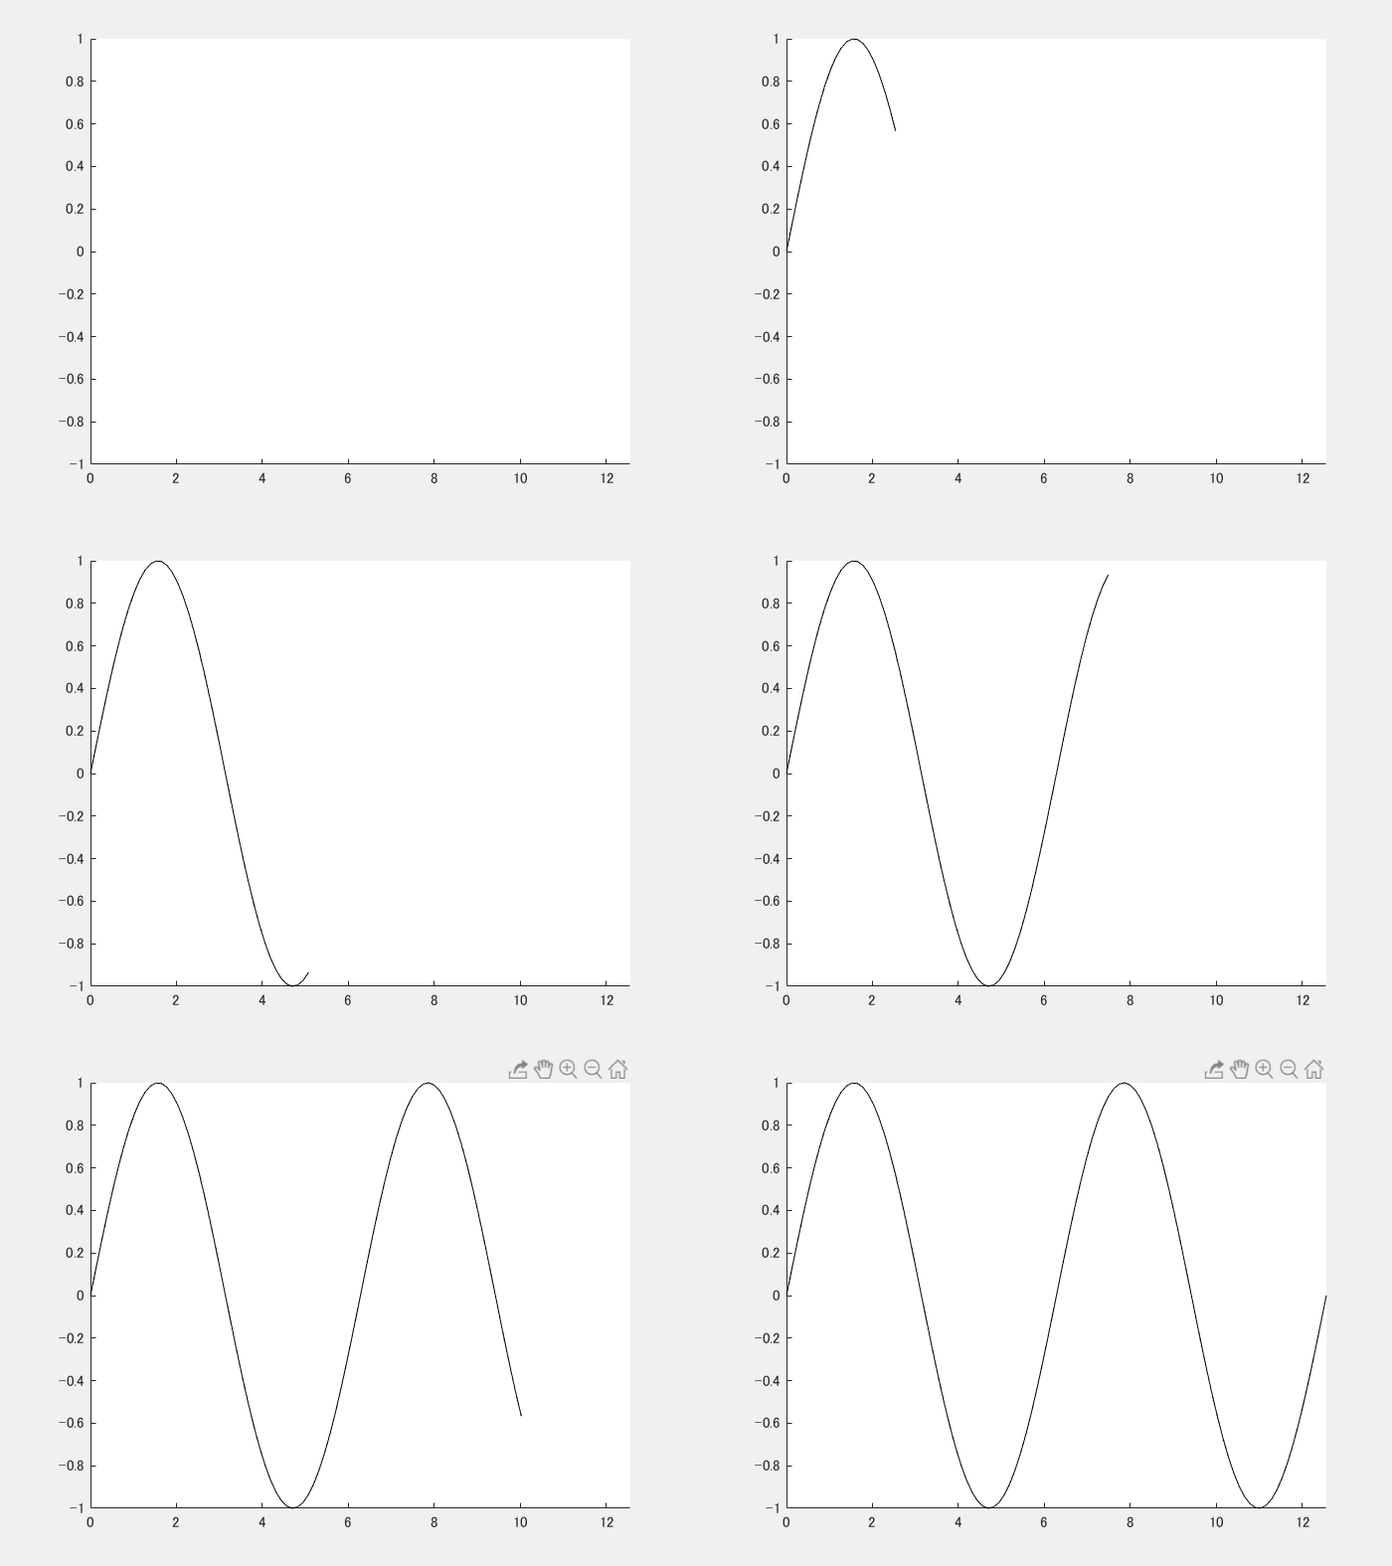
1. アニメーション(gif 作成)
ループで新規データを追加してアニメーションを作成するのに Animatedlineオブジェクト を使います。
データの追加には addpoints を使用します。
この部分はリンク先のサンプルコードに GIFファイルへの出力を加えたものです。
close
N = 100;
x = linspace(0,4*pi,N);
y = sin(x);

filename = 'animation_sample.gif'; % Specify the output file name

h = animatedline;
axis([0,4*pi,-1,1]) % x軸の表示範囲を固定

for k = 1:length(x)
    addpoints(h,x(k),y(k)); % ループでデータを追加
    drawnow % グラフアップデート

    frame = getframe(gcf); % Figure 画面をムービーフレーム(構造体)としてキャプチャ
    tmp = frame2im(frame); % 画像に変更
    [A,map] = rgb2ind(tmp,256); % RGB -> インデックス画像に
    if k == 1 % 新規 gif ファイル作成
        imwrite(A,map,filename,'gif','LoopCount',Inf,'DelayTime',0.2);
    else % 以降、画像をアペンド
        imwrite(A,map,filename,'gif','WriteMode','append','DelayTime',0.2);
    end
end
2. 背景の追加
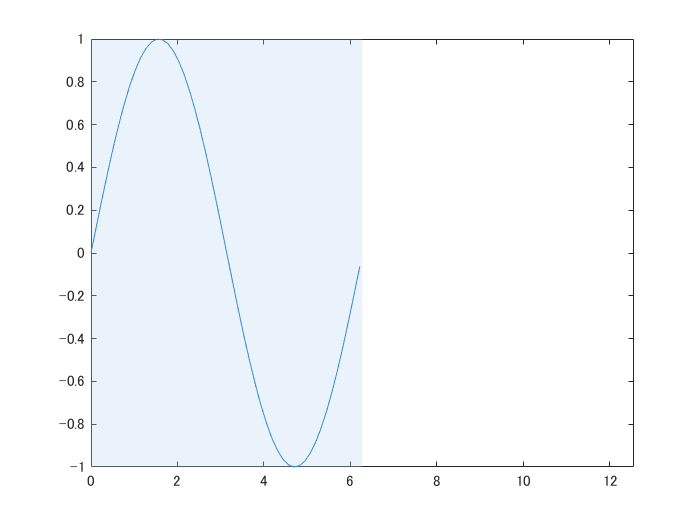
背景色として薄い青を追加してみます。ここでは annotation オブジェクト として四角形を描きます。
グラフに注釈をつけるためのオブジェクトですね。単純な四角形以外にも、楕円文字、矢印やらいろいろあります。
rectangle 関数でも背景を描くことができますが執筆時点では FaceAlpha 未対応だったため、annotation を使用していますが R2024a から rectangle 関数でも FaceAlpha がサポートされました。座標指定が楽なため rectangle や xregion の方がおすすめです。(2024/4/4 追記)
データを半分だけ描いてそれに合わせて四角形の大きさを決めるの部分を紹介します。
キモは Axes オブジェクトの Position プロパティです。
公式ページ:Axes オブジェクトのプロパティ から引用すると
Position — ラベルの余白を除いたサイズと位置
ラベルの余白を除いたサイズと位置。[left bottom width height] の形式の 4 要素ベクトルとして指定します。既定では、MATLAB はコン>テナーを基準に正規化された単位で値を測定します。単位を変更するには、Units プロパティを設定します。
left 要素と bottom 要素は、コンテナー (通常は Figure、パネルまたはタブ) の左下隅から位置境界の左下隅までの距離を定義します。
width 要素と height 要素は、位置境界の寸法です。3 次元表示の座標軸では、Position プロパティは座標軸を囲む最小の四角形です。
この Axes オブジェクトの大きさ(Figure全体における相対位置)に合わせて、四角形の Annotation オブジェクトの位置・サイズを決めます。
N = 100;
x = linspace(0,4*pi,N);
y = sin(x);
plot(x(1:N/2),y(1:N/2)); % 0 => 2*pi までプロット

xmin = 0;
xmax = 4*pi;
axis([xmin,xmax,-1,1]) % 表示範囲は 0 -> 4*pi


handle_axes = gca; % 座標軸オブジェクトのハンドル確保
pos = handle_axes.Position; % 座標軸オブジェクトの位置、サイズ情報を確保

xleft = pos(1); % 左端の位置
wleft = pos(3)/(xmax - xmin).*2*pi; % x軸方向の大きさ

ha1 = annotation('rectangle',...
    [xleft pos(2) wleft pos(4)],...
    'Color','none',...
    'FaceColor',[0.73 0.83 0.95],... % 薄青
    'FaceAlpha',0.3); % 透明度
3. 背景追加+更新を行う関数作成
新しく追加されたデータの x 座標値に合わせて、動的に四角形を描画できるように関数にしてみます。
x座標の左側を薄い青、そして右側を薄い赤、それぞれの四角形を Annotation オブジェクトで描画します。
function [ha1, ha2] = drawRectangles(ax, current, xlim)
% rectangle を作成
apos = ax.Position; % 座標軸オブジェクトの位置、サイズ情報を確保

xleft = apos(1); % 座標軸左端
wleft = apos(3)/(xlim(2)-xlim(1)).*(current-xlim(1)); % x座標値の位置

xright = apos(1) + wleft;
wright = apos(3) - wleft;

ha1 = annotation('rectangle',...
    [xleft apos(2) wleft apos(4)],... % current より左側
    'Color','none',...
    'FaceColor',[0.73 0.83 0.95],... % 薄い青
    'FaceAlpha',0.3); % 透明度

ha2 = annotation('rectangle',...
    [xright apos(2) wright apos(4)],... % current より右側
    'Color','none',...
    'FaceColor',[0.92 0.84 0.84],... % 薄い赤
    'FaceAlpha',0.3); % 透明度

end
そして上で作られた Annotation オブジェクトを更新する関数がこちら。
オブジェクトを毎回新しく作成するのではなく、オブジェクトの Position プロパティ値を更新します。
function updateRectangles(ax, ha1, ha2, current, xlim)

apos = ax.Position;
xleft = apos(1);
wleft = apos(3)/(xlim(2)-xlim(1)).*(current-xlim(1));

xright = apos(1) + wleft;
wright = apos(3) - wleft;

ha1.Position = [xleft apos(2) wleft apos(4)];
ha2.Position = [xright apos(2) wright apos(4)];

end
4. そして最終形
close all
filename = 'animation_sampleFinal.gif'; % Specify the output file name

h = animatedline;
axis([0,4*pi,-1,1])
ha = gca;
[ha1,ha2] = drawRectangles(ha, 0, [0,4*pi]);

N = 100;
x = linspace(0,4*pi,N);
y = sin(x);
for k = 1:length(x)
    addpoints(h,x(k),y(k));
    updateRectangles(ha, ha1, ha2, x(k), [0,4*pi]);
    drawnow

    frame = getframe(gcf); % Figure 画面をムービーフレーム(構造体)としてキャプチャ
    tmp = frame2im(frame); % 画像に変更
    [A,map] = rgb2ind(tmp,256); % RGB -> インデックス画像に
    if k == 1 % 新規 gif ファイル作成
        imwrite(A,map,filename,'gif','LoopCount',Inf,'DelayTime',0.2);
    else % 以降、画像をアペンド
        imwrite(A,map,filename,'gif','WriteMode','append','DelayTime',0.2);
    end
end


