この記事は、時間がないけど新しい技術をサクッと吸収したい人向けです。サーバ監視のPrometheus+Grafanaをとにかくお手軽に自分のWindows PC1台だけで動かして、体感することを狙いとしています。
ゴール
最終的に、以下のようなGrafanaのダッシュボードがブラウザ上に表示されることを目指します。

環境
・OS: Windows10 Pro (1803) x64 (日本語版)
・Prometheus: v2.3.2 (windows-amd64)
・WMI exporter: v0.3.4 (amd64)
・Grafana: v5.2.2 (windows-amd64)
作業の流れ
- WMI exporter の導入
- Prometheus の導入
- Grafana の導入
WMI exporter の導入
ダウンロード
以下から、「wmi_exporter-amd64.zip」をダウンロードして展開
https://github.com/martinlindhe/wmi_exporter/releases

WMI exporter の起動
「wmi_exporter.exe」をエクスプローラーからダブルクリックで実行。
そうすると、以下のようなコマンドプロンプトが起動されます。

途中、エラー表示されているが、とりあえず無視。
Prometheus の導入
ダウンロード
以下のサイトに行く。
https://prometheus.io/download/
プルダウンで次の値を選択する。
・Operating system: windows
・Architecture: amd64
そこで表示されている「prometheus-2.3.2.windows-amd64.tar.gz」をダウンロードして、展開する。

Prometheus の起動
設定ファイルの修正
「prometheus.yml」の「scrape_configs > static_configs > targets]を以下の通り変更します。
変更前: ['localhost:9090']
変更後: ['localhost:9182']
これは、WMI exporterを監視するように変更するようですね。
# my global config
global:
  scrape_interval:     15s # Set the scrape interval to every 15 seconds. Default is every 1 minute.
  evaluation_interval: 15s # Evaluate rules every 15 seconds. The default is every 1 minute.
  # scrape_timeout is set to the global default (10s).

# Alertmanager configuration
alerting:
  alertmanagers:
  - static_configs:
    - targets:
      # - alertmanager:9093

# Load rules once and periodically evaluate them according to the global 'evaluation_interval'.
rule_files:
  # - "first_rules.yml"
  # - "second_rules.yml"

# A scrape configuration containing exactly one endpoint to scrape:
# Here it's Prometheus itself.
scrape_configs:
  # The job name is added as a label `job=<job_name>` to any timeseries scraped from this config.
  - job_name: 'prometheus'

    # metrics_path defaults to '/metrics'
    # scheme defaults to 'http'.

    static_configs:
    # - targets: ['localhost:9090']
    - targets: ['localhost:9182']
起動
「prometheus.exe」をエクスプローラーからダブルクリックで実行。
そうすると、以下のようなコマンドプロンプトが起動されます。

「"Server is ready to receive web requests."」が出力されていれば、大丈夫だと思います
Prometheus の実行確認
ブラウザで「http://localhost:9090」を開くと、以下のような画面になります。

「- insert metric at cursor -」の所で「up」を選択して、「Execute」する。
その後「Graph」タブに切り替えると、以下のようなグラフが表示されます。

「Status > Targets」を選択すると、以下のように表示されます。

。
Grafana の導入
ダウンロード
以下から、「grafana-5.2.2.windows-amd64.zip」をダウンロードして展開
https://grafana.com/grafana/download?platform=windows

「wget https://s3-us-west-2.amazonaws.com/grafana-releases/release/grafana-5.2.2.windows-amd64.zip」
のurl部分をブラウザに設定して、そのままダウンロードして、展開。
data フォルダの作成
適当な場所に、「data」フォルダを作成する。
ここでは、「c:\grafana-5.2.2\data」を作成したものとして話を進めます。
設定ファイルの変更
「conf/sample.ini」を「conf/custom.ini」にコピーして、以下の通り3箇所を変更。
[変更前]
[paths]
# Path to where grafana can store temp files, sessions, and the sqlite3 db (if that is used)
;data = /var/lib/grafana

# Directory where grafana can store logs
;logs = /var/log/grafana

# Directory where grafana will automatically scan and look for plugins
;plugins = /var/lib/grafana/plugins
[変更後]
[paths]
# Path to where grafana can store temp files, sessions, and the sqlite3 db (if that is used)
# ;data = /var/lib/grafana
;data = C:\grafana-5.2.2\data

# Directory where grafana can store logs
# ;logs = /var/log/grafana
;logs = C:\grafana-5.2.2\data\log

# Directory where grafana will automatically scan and look for plugins
# ;plugins = /var/lib/grafana/plugins
;plugins = C:\grafana-5.2.2\data\plugins
Grafana の起動
コマンドプロンプトで、「grafana-5.2.2\bin」に移動して、以下を実行。
grafana-server.exe --config ..\conf\custom.ini
すると、初回は以下のダイアログが表示されるので「アクセスを許可する」。

Grafana の実行確認
ブラウザで「http://localhost:3000」を開くと、ログイン画面になるので「admin/admin」で入る。

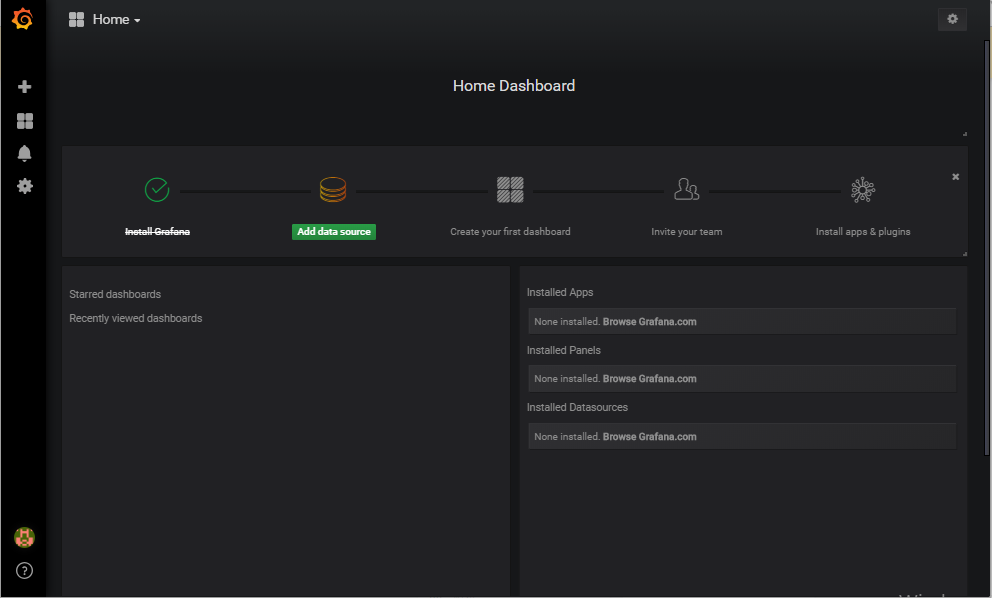
すると、以下のような画面。
DataSource の作成
「Add data source」を指定します。
Data sourceを設定する画面が表示されます。
以下のように設定します。
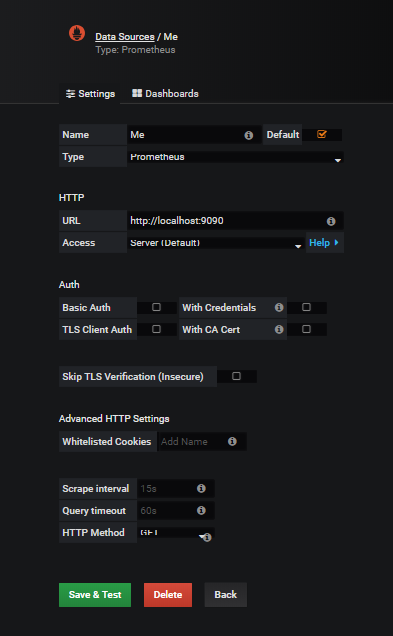
・Name: 適当な名前
・Type: Prometheus
・HTTP > URL: http://localhost:9090
・HTTP > Access: Server(Default)
これで、「Save & Test」。
「Data source is working」と表示されればOK。
Dashboard のダウンロード
以下にアクセスする。
https://grafana.com/dashboards

「Filter by > Search within this list」で、「wmi_exporter」と記載すると、「Windows Node」が表示されるので、それを選択します。

右側の「Download JSON」を選択して、JSONファイルをダウンロードします。
ここでは、デフォルトの「windows-node_rev3.json」という名称で保存します。
Dashboard のインポートとダッシュボードの表示
再び Grafana に戻り、「Create > Import」を選択します。

「Upload .json File」を選択し、先程ダウンロードしたJSONファイルを指定してください。
以下のような画面になります。

「Options > prometheus」に、作成したData sourceのNameを選択してください。
「Import」ボタンを押します。
そうすると、以下のようなダッシュボードがめでたく表示されると思います。
最後に
Grafanaのダッシュボードがめでたく表示されたら、ダッシュボードのBOXを移動したり、最大化表示したりと、色々と遊んでください。
さて、ここまでで15分でできたでしょうか?
実際にどれぐらい時間がかかったかを教えていただけると、参考になります。