はじめに
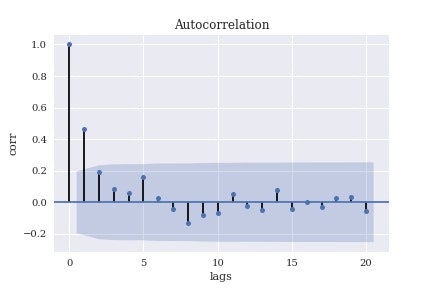
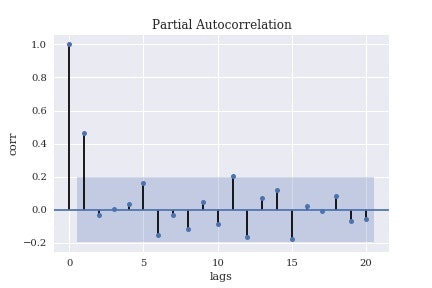
自己相関係数と偏自己相関係数をグラフに描いたコレログラムをpythonでプロットする方法を述べる.
自己相関係数のプロット
statsmodels.apiの関数sm.graphics.tsa.plot_acfを用いる.
自己偏相関係数のプロット
statsmodels.apiの関数sm.graphics.tsa.plot_pacfを用いる.
例
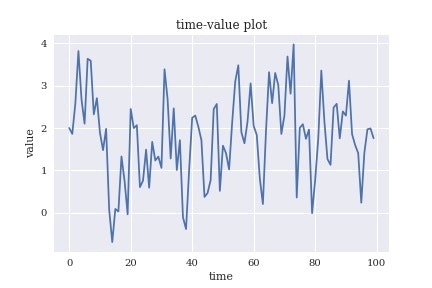
例として,以下のAR(1)モデルの自己相関係数をプロットする.
y_t = 1 + 0.5 y_{t-1} + \epsilon_t
ただし,$\epsilon_t$は分散1の正規ホワイトノイズとする.
また,$y_0=2$とする.
# モジュールの取り込みとグラフをいい感じにするおまじない
import matplotlib as mpl
import matplotlib.pyplot as plt
plt.style.use('seaborn')
mpl.rcParams['font.family'] = 'serif'
%matplotlib inline
import numpy as np
import statsmodels.api as sm

# プロットするデータ列の作成
# 今回は100個の時刻におけるデータを取り込む
y = np.zeros(100)
np.random.seed(42)
epsilon = np.random.standard_normal(100)
y[0] = 2
for t in range(1,100):
    y[t] = 1 + 0.5 * y[t-1] + epsilon[t]

# プロットする時系列データを見てみる
plt.plot(y)
plt.xlabel('time')
plt.ylabel('value')
plt.title('time-value plot');
# 自己相関係数のプロット
sm.graphics.tsa.plot_acf(y, lags=20)
plt.xlabel('lags')
plt.ylabel('corr')

# 偏自己相関係数のプロット
sm.graphics.tsa.plot_pacf(y, lags=20)
plt.xlabel('lags')
plt.ylabel('corr')


