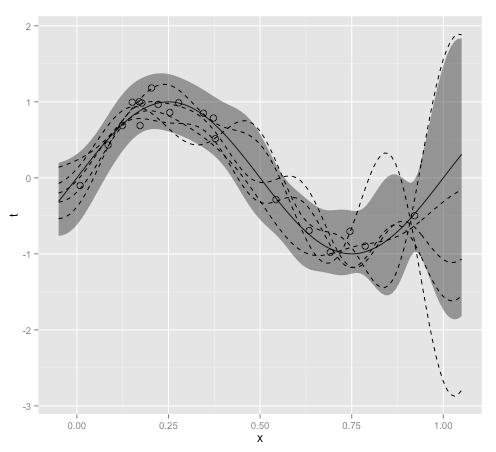
ベイズ線形回帰(PRML§3.3)の図版再現を見て、ちょうどこのあたりを社内読書会で読んでいたところだったので、理解を深めるためにRで実装しなおしてみた。
library(ggplot2)
library(MASS)
library(mvtnorm)

# our example data points are generated from this function with gaussian noise
underlining_function <- function(x) sin(x * pi * 2)

# params for prior probability
S <- 0.1
ALPHA <- 0.1
BETA <- 9

# use 9 gaussian basis functions
NUM_BASES <- 9

basis_centers <- seq(0, 1, length=NUM_BASES)

gaussian_basis_func <- function(x, sigma, mu) dnorm(x, mean=mu, sd=sigma)

apply_gaussian_basis_funcs_to_xs <- function(xs) {
  phis <- matrix(0, nrow=length(xs), ncol=NUM_BASES)
  for (m in 1:NUM_BASES) {
    phis[,m] <- dnorm(xs, sd=S, mean=basis_centers[m])
  }
  return(phis)
}

# observed data points (underlining function plus some noise)
NUM_OBSERVED <- 20

observed <- data.frame(x = runif(NUM_OBSERVED, min=0.0, max=1.0))
observed$t <- underlining_function(observed$x) + rnorm(NUM_OBSERVED, mean=0.0, sd=0.1)

# graph boundaries
xmin <- -0.05
xmax <-  1.05
ymin <- -1.5
ymax <-  1.5

x_ <- seq(xmin, xmax, by=0.01)
t_ <- seq(ymin, ymax, by=0.01)

# data frame for plot
df <- data.frame(x = x_, t = underlining_function(x_))

# design matrix
PHI <- apply_gaussian_basis_funcs_to_xs(observed$x)

# posterior distribution
S_N_inv <- ALPHA * diag(NUM_BASES) + BETA * t(PHI) %*% PHI
S_N <- ginv(S_N_inv)
m_N <- BETA * S_N %*% t(PHI) %*% observed$t

# predictive distribution
phix <- apply_gaussian_basis_funcs_to_xs(x_)
predictive_distribution_mean <- phix %*% m_N # vectorized.
predictive_distribution_sd <- apply(phix, 1, function(phis) sqrt(1.0 / BETA + t(phis) %*% S_N %*% phis))

df$predictive_distribution_low <- predictive_distribution_mean - predictive_distribution_sd
df$predictive_distribution_high <- predictive_distribution_mean + predictive_distribution_sd

# plot
plt <- ggplot(df, aes(x = x)) +
  xlim(xmin, xmax) + #ylim(ymin, ymax) +
  geom_line(aes(y = t)) +
  geom_ribbon(aes(ymin=predictive_distribution_low, ymax=predictive_distribution_high), alpha=0.5) +
  geom_point(data=observed, aes(x = x, y = t), shape=1, size=3)

#   print(plt)

for (i in 1:5) {
  # pick some w from posterior distribution
  w <- mvrnorm(mu=m_N, Sigma=S_N)
  hypothesis <- data.frame(x = x_, t = phix %*% w)
  plt <- plt + geom_line(data=hypothesis, aes(x=x, y=t), linetype=2)
}
print(plt)
PythonをRに写経してみて思ったのは、Pythonはラムダの配列を作れるのが便利。mapとかあるし。Rはラムダが作れるが、リストしかできないしmap的なのが難しい。
Rはデータ構造がvectorだとかmatrixだとかlistだとかdata.frameだとか似たようなのがいくつもあって面倒。applyとかsapplyとか調べても、バッチリ欲しいデータ構造で出力してくれなかったり。上のプログラムではpredictive_distribution_sdがvectorで、predictive_distribution_meanが1列のmatrixだけど、普通に足し合わせることができるならもうvectorとか要らないのに。
あとggplot2でylimとgeom_ribbonの相性が良くなくて、geom_ribbonの上下の境界がylimの範囲を出るとプロットされなくなる。なのでylimをコメントアウトしてある。
