はじめに
前にYellowbrickを少し試してみた1のだが、ほとんどYellowbrickのサンプルコードをベースに動かしてみただけだったので、もう少しYellowbrickでできることを調べてみた。
今回は、よくkaggleなどでも使われているLightGBMをYellowbrickを使いつつ構築し、モデルを保存するところまでやってみる。
ただし、特徴量の作り込みなどの前処理や詳細なモデルの精度評価についてはYellowbrickでできないこともあるので、扱わない。
環境
実行環境は次の通り。
$sw_vers
ProductName:	Mac OS X
ProductVersion:	10.13.6
BuildVersion:	17G8037
$python3 --version
Python 3.7.4
Yellowbrickのインストールについては1で記載したため、省略する。
LightGBMのインストールはこちら2を参考にした。
モデルの構築
準備
今回使うライブラリをインポートする。
import pandas as pd
import numpy as np

import yellowbrick
from yellowbrick.datasets import load_bikeshare
from yellowbrick.model_selection import LearningCurve,ValidationCurve,FeatureImportances
from yellowbrick.regressor import ResidualsPlot


import lightgbm as lgb

from sklearn.model_selection import train_test_split
from sklearn.metrics import mean_squared_error
from joblib import dump, load
データはYellowbrickで準備されているload_bikeshareを使用する。
# Load data
X, y = load_bikeshare()
print(X.head())
説明変数は12個あり、全て数値データ。目的変数はシェアバイクの貸出数。
今回はこのデータをこのままLightGBMに投入してモデルを作ってみる。
   season  year  month  hour  holiday  weekday  workingday  weather  temp  \
0       1     0      1     0        0        6           0        1  0.24
1       1     0      1     1        0        6           0        1  0.22
2       1     0      1     2        0        6           0        1  0.22
3       1     0      1     3        0        6           0        1  0.24
4       1     0      1     4        0        6           0        1  0.24

   feelslike  humidity  windspeed
0     0.2879      0.81        0.0
1     0.2727      0.80        0.0
2     0.2727      0.80        0.0
3     0.2879      0.75        0.0
4     0.2879      0.75        0.0
学習の前にデータを学習用と検証用に分割。分割の割合はテキトーに8:2に設定。
# Train-test split
X_train, X_test, y_train, y_test = train_test_split(X, y, test_size=0.2)
モデルは先述のようにLightGBMを使用。
ただし、Yellowbrickがscikit-learnの拡張版のようなライブラリなので、LightGBMもscilit-learnのAPI3を使用。
# Model
model = lgb.LGBMRegressor()
チューニングしてみる
ここで、YellowbrickのValidationCurveを使って、ハイパーパラメタを決めてみる。
今回は試しにmax_depth、n_estimators、num_leavesの値と精度の関係を調べてみる。
ValidationCurveのAPI仕様などはこちら4を参照。
次のように、ValidationCurveの引数にモデルや、調べるパラメタ名、パラメタのレンジを指定する。cvは交差検定の分割数や、ジェネレータを設定できる。今回は、交差検定の分割数を5に設定している。最後のscoringは精度を見るための指標を指定しているところで、scikit-learnで定義されている指標5のうち、neg_mean_squared_errorを設定した。
visualizer = ValidationCurve(
    model, param_name="max_depth",
    param_range=np.arange(1, 11), cv=5, scoring='neg_mean_squared_error'
)
visualizer.fit(X_train, y_train)
visualizer.show()
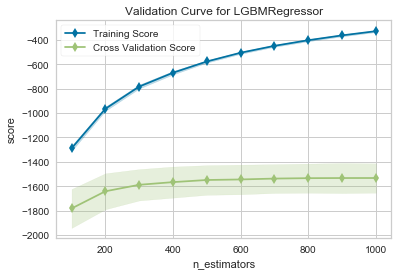
出力は下図の通りで、縦軸はneg_mean_squared_errorになっている。
この指標は文字通り、平均2乗誤差を(-1)倍しているので、図中の上側(0に近い方向)が精度が高いことを示している。
Cross Validation Scoreを見るとmax_depthが6以上だとほとんど精度が変わらないので、max_depthは6に設定する。
次にn_estimatorsについて同様に調べてみる。プログラムは以下の通り。
visualizer = ValidationCurve(
    model, param_name="n_estimators",
    param_range=np.arange(100, 1100, 100), cv=5, scoring='neg_mean_squared_error'
)
visualizer.fit(X_train, y_train)
visualizer.show()
出力は下図の通り。Cross Validation Scoreを見るとnestimatorsが600以上だとほとんど精度が変わらないので、n_estimatorsは600に設定する。
最後にnum_leavesについても同様に調べてみる。プログラムは以下の通り。
visualizer = ValidationCurve(
    model, param_name="num_leaves",
    param_range=np.arange(2, 54, 4), cv=5, scoring='neg_mean_squared_error'
)
visualizer.fit(X_train, y_train)
visualizer.show()
この出力は下図の通り。Cross Validation Scoreを見ると、num_leavesが20以上で精度がほとんど変わっていないので、20と設定する。
以上のようにValidationCurveでパラメタの簡易的なチューニングをすることができた。
改めてモデルを定義する。
# Model
model = lgb.LGBMRegressor(
    boosting_type='gbdt',
    num_leaves=20,
    max_depth=6,
    n_estimators=600,
    random_state=1234,
    importance_type='gain')
学習曲線を描いてみる
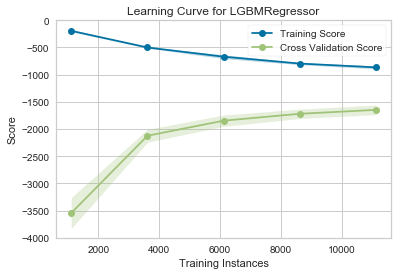
モデルがアンダーフィットあるいはオーバーフィットしているか確認するために、
学習用データの量を変えていきながらモデルの精度を見てみる。
LearningCurveを使うことで簡単に可視化することができる。
visualizer = LearningCurve(model, cv=5, scoring='neg_mean_squared_error')
visualizer.fit(X_train, y_train)
visualizer.show()
結果は下図の通り。データ量が増えていくにつれてCross Validation Scoreの精度が良くなっている様子がわかる。もし仮にデータ量がもっと増やせるとしても、劇的に精度が良くなることはなさそう。
特徴量の重要度
シェアバイクの貸出数を予測する際の重要度順で説明変数を表示することも簡単にできる。
visualizer = FeatureImportances(model)
visualizer.fit(X_train, y_train)
visualizer.show()
結果は下図の通り。一番効いているのは、1日の時間帯となった。
この重要度を100として、他の変数を表示している。
モデルの精度
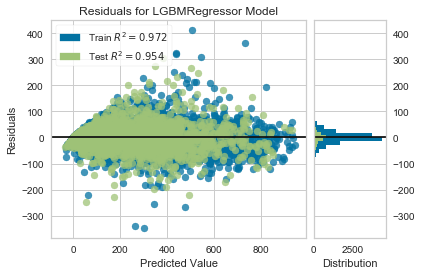
前の記事1でも示したのだが、残差分布で精度を確認。
visualizer = ResidualsPlot(model)
visualizer.fit(X_train, y_train)
visualizer.score(X_test, y_test)
visualizer.show()
出力は下図の通り。
散布図を見ると予測値が外しているところもあるが、$R^2$値で0.9以上出ていて、
ヒストグラムの残差分布をみると残差が0のあたりにピークがあるので精度は良さそう。
図中に表示するスコアが$R^2$以外の指標に変えられなそうなので、改めてRMSEを計算すると38程度だった。
それらしいモデルができたので、モデル構築はここで終了とする。
model = model.fit(X_train, y_train)
y_pred = model.predict(X_test)
print('The rmse of prediction is:', mean_squared_error(y_test, y_pred) ** 0.5)
# The rmse of prediction is: 38.82245025441572
モデルの保存
構築したモデルを保存する。Scikit-learnで調べて見るとjoblibで保存する方法が記載6されていたので、同様に保存する。
dump(model, 'lightgbm.joblib')
さいごに
以上のプログラムでは、LightGBMのサンプルコード7も参考にしている。
Yellowbrickで簡単にモデルの精度や検証に使えるプロットを確認できるので、便利だなーという印象。
ただ一方で、毎回Visualizerに「fit」させるところがなんとなく違和感...
-
https://qiita.com/dyamaguc/items/20e5c3f433d79009e940 ↩ ↩2 ↩3
-
https://lightgbm.readthedocs.io/en/latest/Python-API.html#scikit-learn-api ↩
-
https://scikit-learn.org/stable/modules/model_evaluation.html ↩
-
https://scikit-learn.org/stable/modules/model_persistence.html ↩
-
https://github.com/microsoft/LightGBM/blob/master/examples/python-guide/simple_example.py ↩


