はじめに
最近いくつか記事を投稿してきましたが、これまでの合計閲覧数などのデータを見てみたいと思い、ラズパイで環境を作ってみました。今回は、ラズパイで定期的にデータを取得し、1日に1回グラフを作ってSlackに自動送信することをゴールとします。
環境
主に開発を行うMacの環境は次の通りです。
$sw_vers
ProductName:	Mac OS X
ProductVersion:	10.13.6
BuildVersion:	17G9016
使用するラズパイはRaspberry Pi 3 Model Bを使用しています。OSは次の通りです。
$ cat /etc/os-release
PRETTY_NAME="Raspbian GNU/Linux 10 (buster)"
NAME="Raspbian GNU/Linux"
VERSION_ID="10"
VERSION="10 (buster)"
VERSION_CODENAME=buster
ID=raspbian
ID_LIKE=debian
HOME_URL="http://www.raspbian.org/"
SUPPORT_URL="http://www.raspbian.org/RaspbianForums"
BUG_REPORT_URL="http://www.raspbian.org/RaspbianBugs"
構築
ラズパイはしばらく使っていなかったのですが、再度使おうとしたらログインできず、パスワード変更しようとしたらOSが起動しなくなってしまったので、OSを再インストールするところから始めます。
その後必要なライブラリやツールをインストールして、Qiitaのデータを格納するMySQL(MariaDB)を構築します。
最後にSlackに定期送信するような処理を作っていきます。
Raspberry Pi OS再インストール
OS再インストールはこちら1の記載通りに実行してOSを起動できるようになりました。手順については全く記載通りなので、省略します。
apt updateをエラーで実行できない問題が発生しました。試行錯誤していたところ、こちら2に記載している通り、
sudo dhclient eth0
これで問題解決しました。その後、次のコマンドを実行しておきます。
sudo apt-get update
sudo apt-get upgrade
DBセットアップ
次にQiitaの閲覧数などのデータを格納するデータベースを構築します。今回はMySQLを使用します。
しかし、MySQLをインストールしようとしたところ、
$ sudo apt-get install mysql-server
パッケージリストを読み込んでいます... 完了
依存関係ツリーを作成しています
状態情報を読み取っています... 完了
パッケージ mysql-server は使用できませんが、別のパッケージから参照されます。
これは、パッケージが欠落しているか、廃止されたか、または別のソース
からのみ利用可能であることを意味します。
しかし、以下のパッケージが置き換えます:
  mariadb-server-10.0

E: パッケージ 'mysql-server' にはインストール候補がありません
とエラーが表示され、インストールできませんでした。
ただエラーメッセージの中でMariaDBが置き換えると表示されているので試したところ、
次のコマンドでインストールできました。
sudo apt-get install mariadb-client mariadb-server
今回はデータ中に日本語を入れようと思っているので、言語の設定をします。
こちら3を参考にして、/etc/mysql/conf.d/mysql.cnfを次のように修正しました。
[mysql]
default-character-set=utf8mb4
MySQLを再起動して、ユーザとデータベースの設定をします。
$ sudo service mysql restart
$ sudo mysql -u root -p
Enter password:
Welcome to the MariaDB monitor.  Commands end with ; or \g.
Your MariaDB connection id is 60
Server version: 10.3.17-MariaDB-0+deb10u1 Raspbian 10

Copyright (c) 2000, 2018, Oracle, MariaDB Corporation Ab and others.

Type 'help;' or '\h' for help. Type '\c' to clear the current input statement.

MariaDB [(none)]> CREATE DATABASE myqiita;
MariaDB [(none)]> CREATE USER 'pi'@'localhost' IDENTIFIED BY '<パスワード>';
MariaDB [(none)]> GRANT ALL PRIVILEGES ON myqiita.* to 'pi'@'localhost';
MariaDB [(none)]> FLUSH PRIVILEGES;
MariaDB [(none)]> show databases;
+--------------------+
| Database           |
+--------------------+
| information_schema |
| myqiita            |
+--------------------+
2 rows in set (0.002 sec)

MariaDB [(none)]> quit
Bye
これでユーザpiでログインして、データベースmyqiitaにデータを格納する準備ができました。
データ取得スクリプト作成
先ほど設定したデータベースへの接続関係のコードを書いておきます。
import MySQLdb
import pandas.io.sql as psql

class myDB():

    def __init__(self):
        self.connection = MySQLdb.connect(
            host='localhost',
            user='pi',
            passwd='<パスワード>',
            charset='utf8',
            db='myqiita')
        self.cursor = self.connection.cursor()

    def exe(self, sql):
        self.cursor.execute(sql)
        return self.cursor.fetchall()

    def exedf(self, sql):
        return psql.read_sql(sql, self.connection)

    def commit(self):
        self.connection.commit()

    def close(self):
        self.connection.close()
<パスワード>と記載した部分はMySQLでユーザpiを作成したときのパスワードとなります。
次のプログラムを実行して、データを格納するテーブルmytableを作成しておきます。なお、各列の型指定についてはテキトーな部分もあります。
import MySQLdb
from myconnection import myDB

if __name__ == '__main__':

    mydb = myDB()

    sql = """
    create table mytable(
    id int(11) AUTO_INCREMENT NOT NULL,
    create_datetime datetime not null default current_timestamp,
    tot_num_articles int(11) not null,
    tot_num_views int(11) not null,
    tot_num_likes int(11) not null,
    max_num_views int(11) not null,
    max_num_views_title varchar(100) not null,
    max_num_likes int(11) not null,
    max_num_likes_title varchar(100) not null,
    PRIMARY KEY (id))
    """
    print( sql )
    mydb.exe( sql )
次にQiitaからデータを取得、データベースへ格納するコードを作成します。
import requests
import json
import datetime
import MySQLdb
from myconnection import myDB

def collection():

    dt_now = datetime.datetime.now()

    url = 'https://qiita.com/api/v2/authenticated_user/items'
    headers = {"content-type": "application/json",
               "Authorization": <アクセストークン>}

    res = requests.get(url, headers=headers)
    article_list = res.json()

    tot_num_articles = len(article_list)
    tot_num_views = 0
    tot_num_likes = 0
    max_num_views = 0
    max_num_likes = 0
    max_num_views_title = ''
    max_num_likes_title = ''


    for item in article_list:
        item_id = item['id']
        title = item['title']
        likes_count = item['likes_count']

        url = 'https://qiita.com/api/v2/items/' + item_id
        res = requests.get(url, headers=headers)
        json = res.json()
        page_views_count = json['page_views_count']

        tot_num_views += page_views_count
        tot_num_likes += likes_count

        if max_num_views < page_views_count:
            max_num_views = page_views_count
            max_num_views_title = title

        if max_num_likes < likes_count:
            max_num_likes = likes_count
            max_num_likes_title = title

    data={'dt':dt_now,
            'tot_num_articles':tot_num_articles,
            'tot_num_views':tot_num_views,
            'tot_num_likes':tot_num_likes,
            'max_num_views':max_num_views,
            'max_num_views_title':max_num_views_title,
            'max_num_likes':max_num_likes,
            'max_num_likes_title':max_num_likes_title}
    return data


if __name__ == '__main__':

    mydb = myDB()

    data = collection()

    sql = """
    insert into mytable
    (tot_num_articles,tot_num_views,tot_num_likes,max_num_views,max_num_views_title,max_num_likes,max_num_likes_title)
    values({},{},{},{},"{}",{},"{}")
    """.format(data['tot_num_articles'],
            data['tot_num_views'],
            data['tot_num_likes'],
            data['max_num_views'],
            data['max_num_views_title'],
            data['max_num_likes'],
            data['max_num_likes_title'])
    print(sql)
    mydb.exe(sql)
    mydb.commit()
    mydb.close()
collection()の中でQiitaのAPIを叩いて、データを取得しています。
アクセストークンの取得やデータの取得方法については、こちら4を参考にしています。
main関数の中で、collection()で取得したデータテーブルmytableにinsertし、commitしています。
cronで定期実行
先ほど作成したinsert.pyを定期実行するためにcronに登録しておきます。
sudo vim /etc/cron.d/cron_test
cron_testというファイルを作成して、次のように記載することで毎時00分にinsert.pyが実行されるようになります。
00 * * * * pi /usr/bin/python3 /home/pi/work/insert.py
cronを再起動しておきます。
sudo service cron restart
以上で、データを定期的に取得するところまではできました。
Slackへの定期送信
最後に1日に1回データをグラフにしてSlackに送信するように設定します。
プログラムは次の通りです。
from slacker import Slacker
import monitor

def main():
    monitor.report()

    slack = Slacker("<トークン>")
    slack.files.upload(file_='out_monitor.png', channels='myqiita')

if __name__ == "__main__":
    main()
最初にmonitor.report()としていますが、別のmonitor.pyというプログラムの中でデータベースのデータを取得して、グラフを作成し、out_monitor.pngという名前で保存しています。
このPNGファイルをSlackの自分のチャンネルに送信しています。送信部分についてはこちら5を参考にしました。
monitor.pyのプログラム内容については次の通りです。
import MySQLdb
from myconnection import myDB
import pandas as pd
import matplotlib.pyplot as plt

def report():
    mydb = myDB()

    sql = """
    select * from mytable
    """
    df = mydb.exedf( sql )

    # Preprocess
    df['create_datetime'] = pd.to_datetime(df['create_datetime'])
    df = df.set_index('create_datetime')

    # Plot
    fig = plt.figure()
    ax1 = fig.add_subplot(311)
    df['tot_num_articles'].plot(ax=ax1)
    ax1.set_xticklabels('')
    ax1.set_xlabel('')
    ax1.set_ylabel('tot_num_articles')
    ax1.grid()
    ax2 = fig.add_subplot(312)
    df['tot_num_views'].plot(ax=ax2)
    ax2.set_xticklabels('')
    ax2.set_xlabel('')
    ax2.set_ylabel('tot_num_views')
    ax2.grid()
    ax3 = fig.add_subplot(313)
    df['tot_num_likes'].plot(ax=ax3)
    ax3.set_ylabel('tot_num_likes')
    ax3.grid()
    fig.savefig('out_monitor.png')

if __name__ == '__main__':
    report()
テーブルmyqiitaに格納されているデータを全て取得、pandasのDataFrameにしたあと、グラフにしています。DataFrameへの変換についてはこちら6を参考にしています。
グラフにしている項目は、自分の記事数、総閲覧数、総いいね数としています。
slack_report.pyを定期実行するようにcronにプログラムを登録しておきます。
以下にcron_testの中身を全て表示しています。
# /etc/crontab: system-wide crontab
# Unlike any other crontab you don't have to run the `crontab'
# command to install the new version when you edit this file
# and files in /etc/cron.d. These files also have username fields,
# that none of the other crontabs do.

SHELL=/bin/sh
PATH=/usr/local/sbin:/usr/local/bin:/sbin:/bin:/usr/sbin:/usr/bin

# Example of job definition:
# .---------------- minute (0 - 59)
# |  .------------- hour (0 - 23)
# |  |  .---------- day of month (1 - 31)
# |  |  |  .------- month (1 - 12) OR jan,feb,mar,apr ...
# |  |  |  |  .---- day of week (0 - 6) (Sunday=0 or 7) OR sun,mon,tue,wed,thu,fri,sat
# |  |  |  |  |
# *  *  *  *  * user-name command to be executed
17 *	* * *	root    cd / && run-parts --report /etc/cron.hourly
25 6	* * *	root	test -x /usr/sbin/anacron || ( cd / && run-parts --report /etc/cron.daily )
47 6	* * 7	root	test -x /usr/sbin/anacron || ( cd / && run-parts --report /etc/cron.weekly )
52 6	1 * *	root	test -x /usr/sbin/anacron || ( cd / && run-parts --report /etc/cron.monthly )
00 *	* * *	pi	/usr/bin/python3 /home/pi/work/insert.py
10 8	* * *	pi	/usr/bin/python3 /home/pi/work/slack_report.py
最後にcronを再起動しておきます。
sudo service cron restart
結果
こちらがスマホのSlackに送られたスクリーンショットです。
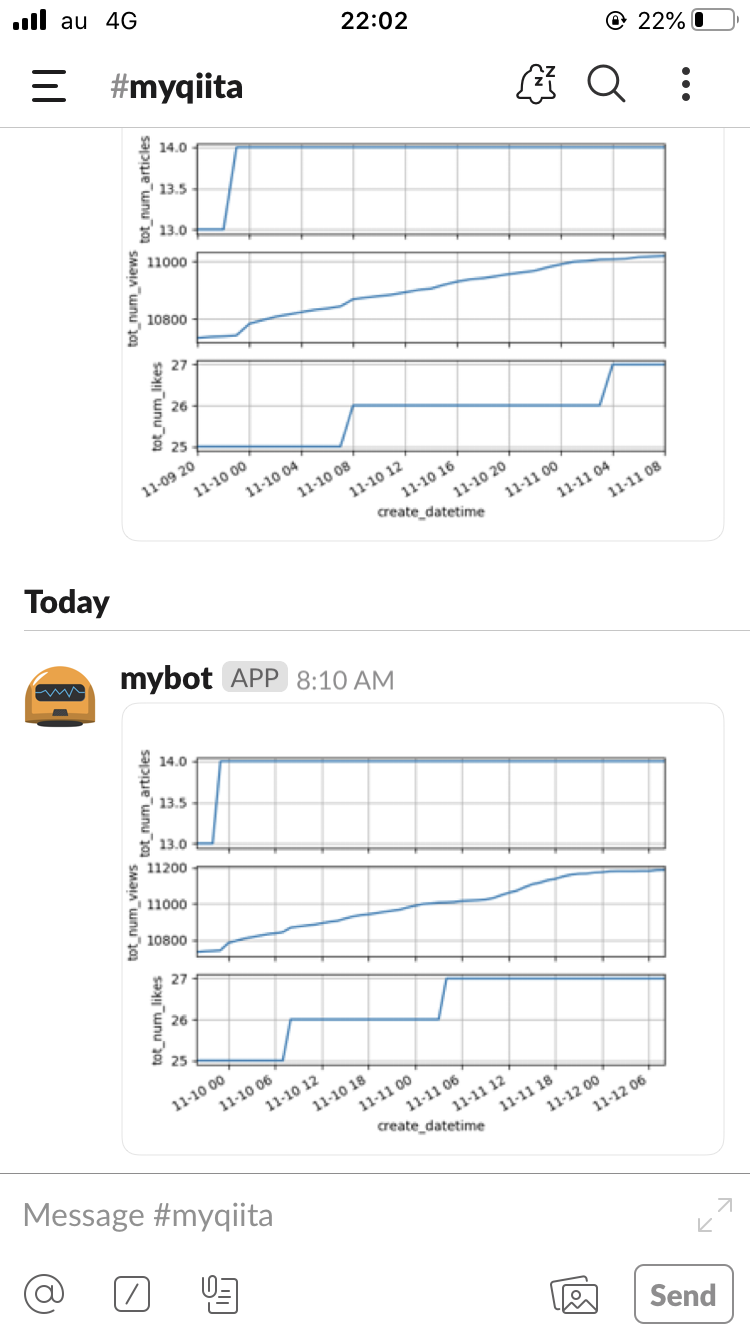
毎日朝8:10にグラフが送られてくるようになりました。よし。
さいごに
ラズパイで定期的にQiitaの閲覧データをSlackに送信するようにできました。
データを見れるようになると、1日の中でも時間帯によって閲覧数の増加量が違っているなーというように気がつく点がいくつか出てくるので、面白いですね。
まだまだ閲覧数やいいね数が少ないですが...