環境
MacOS Yosemiteで動作確認
Install
$ pip install matplotlib
設定
そのまま使うと下のようなエラーがでるので、http://stackoverflow.com/questions/21784641/installation-issue-with-matplotlib-python
を参考に~/.matplotlib/matplotlibrcにbackend: TkAggを書いておく
Python is not installed as a framework. The Mac OS X backend will not be able to function
 correctly if Python is not installed as a framework. See the Python documentation for
more information on installing Python as a framework on Mac OS X. Please either reinstall
Python as a framework, or try one of the other backends.
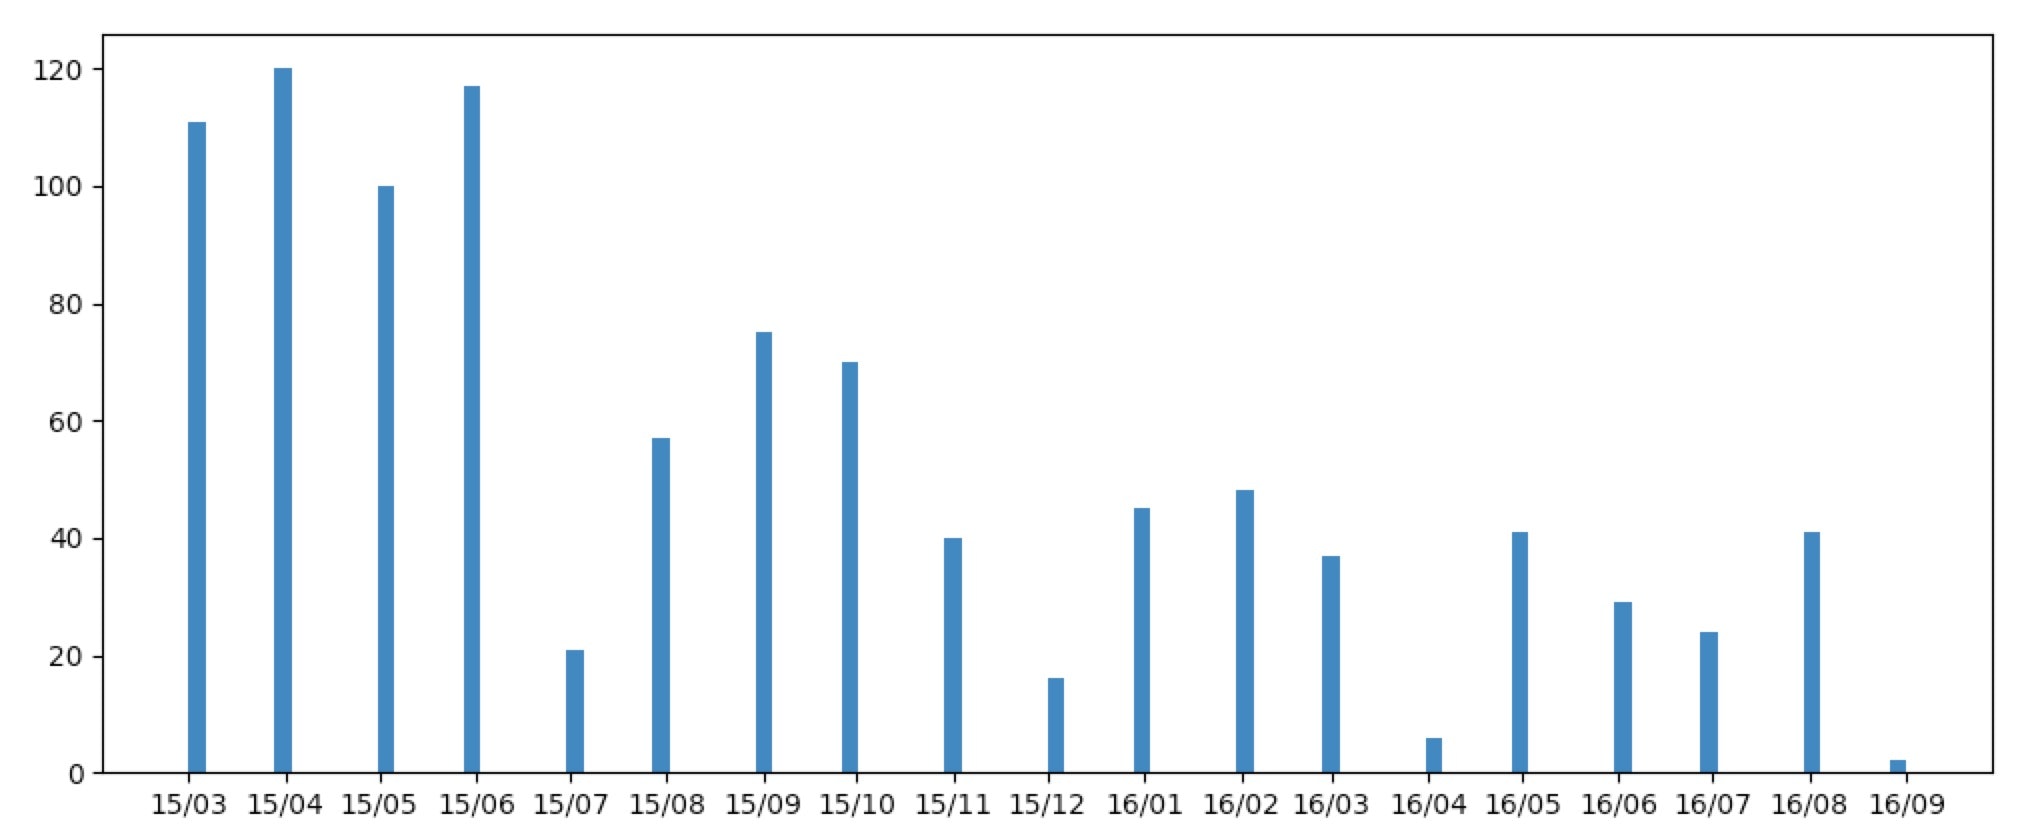
ヒストグラムを書いてみる
import sys
from datetime import datetime
import matplotlib.pyplot as plt
import numpy as np
import matplotlib.dates as mdates

date = []
for line in sys.stdin:
    yymm = line.rstrip()[:-3]
    if yymm:
        date.append(datetime.strptime(yymm, '%y/%m'))
fig, ax = plt.subplots(1,1)

d = mdates.date2num(date)
ax.hist(d, bins=50)
ax.xaxis.set_major_locator(mdates.MonthLocator())
# ax.xaxis.set_major_locator(mdates.AutoDateLocator())
ax.xaxis.set_major_formatter(mdates.DateFormatter('%y/%m'))
plt.show()
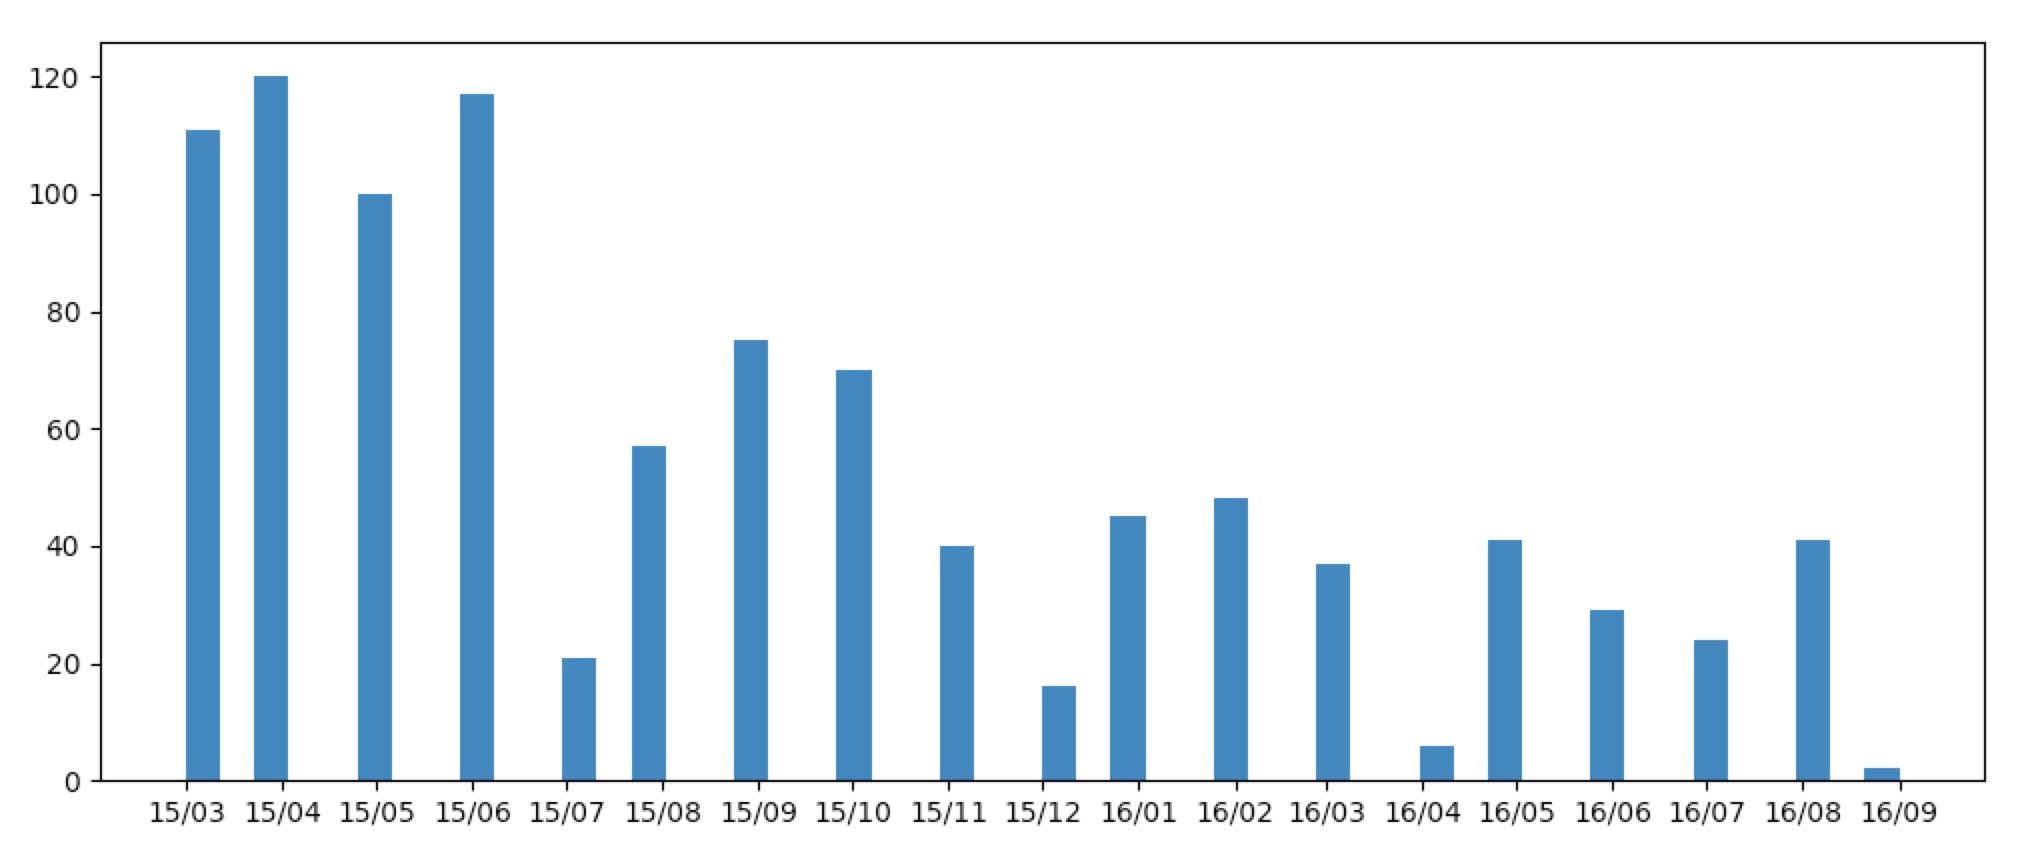
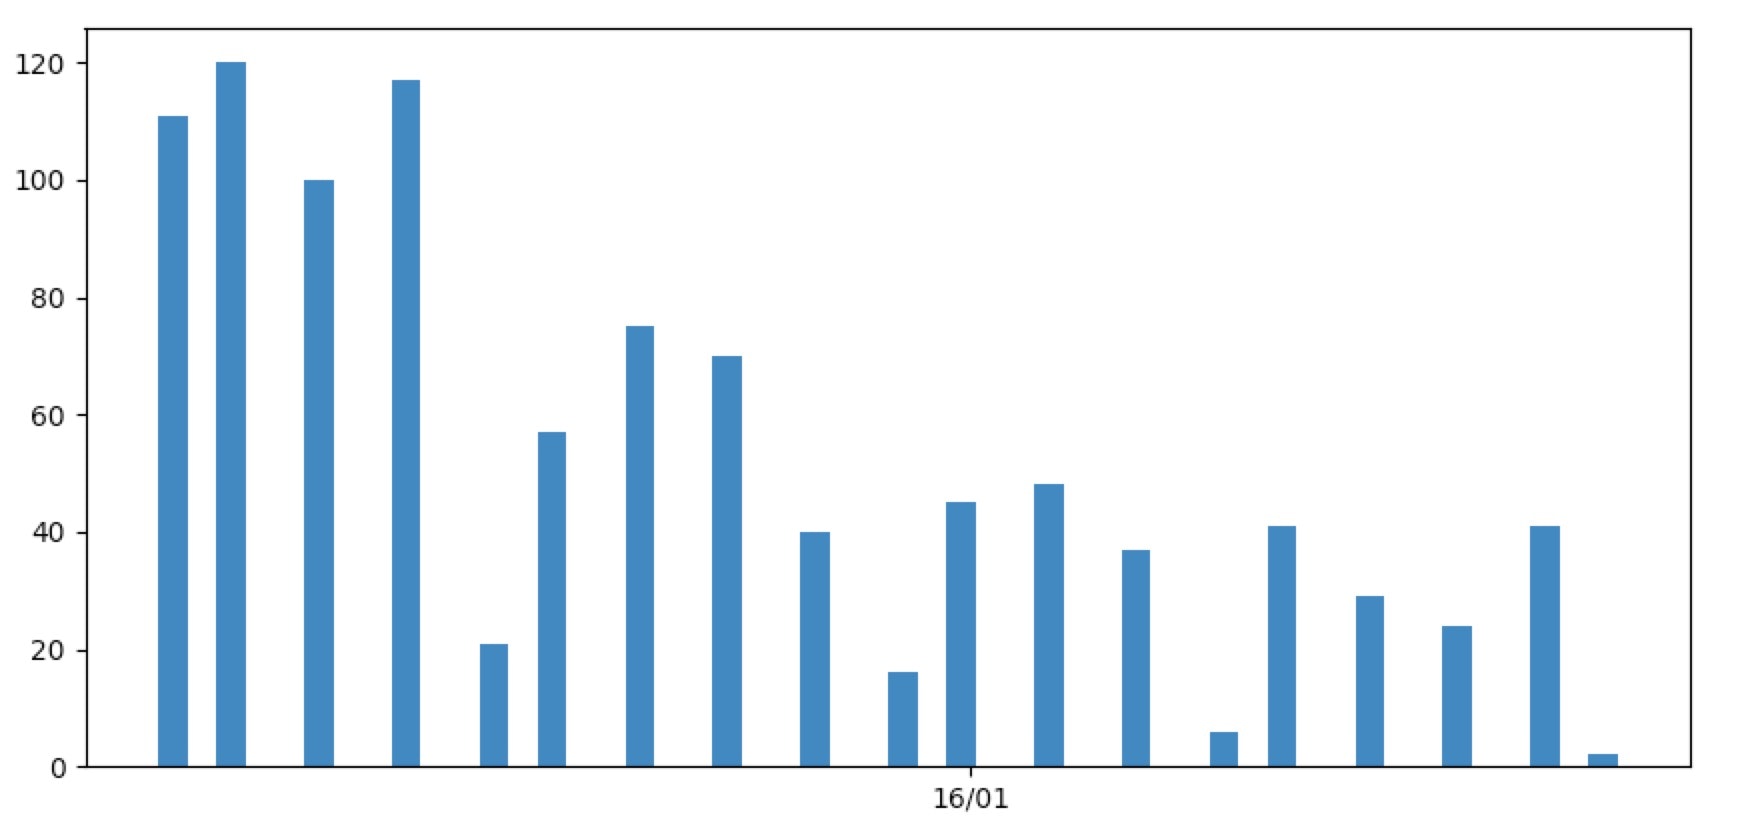
ax.xaxis.set_major_locatorの部分で指定しているmdates.AutoDateLocator()の部分を変更するとx軸の単位を指定できる。mdates.MonthLocator()を指定すると月ごとになる。mdates.YearLocator()だと年ごと。
mdates.MonthLocator()を指定した場合
mdates.YearLocater()を指定した場合
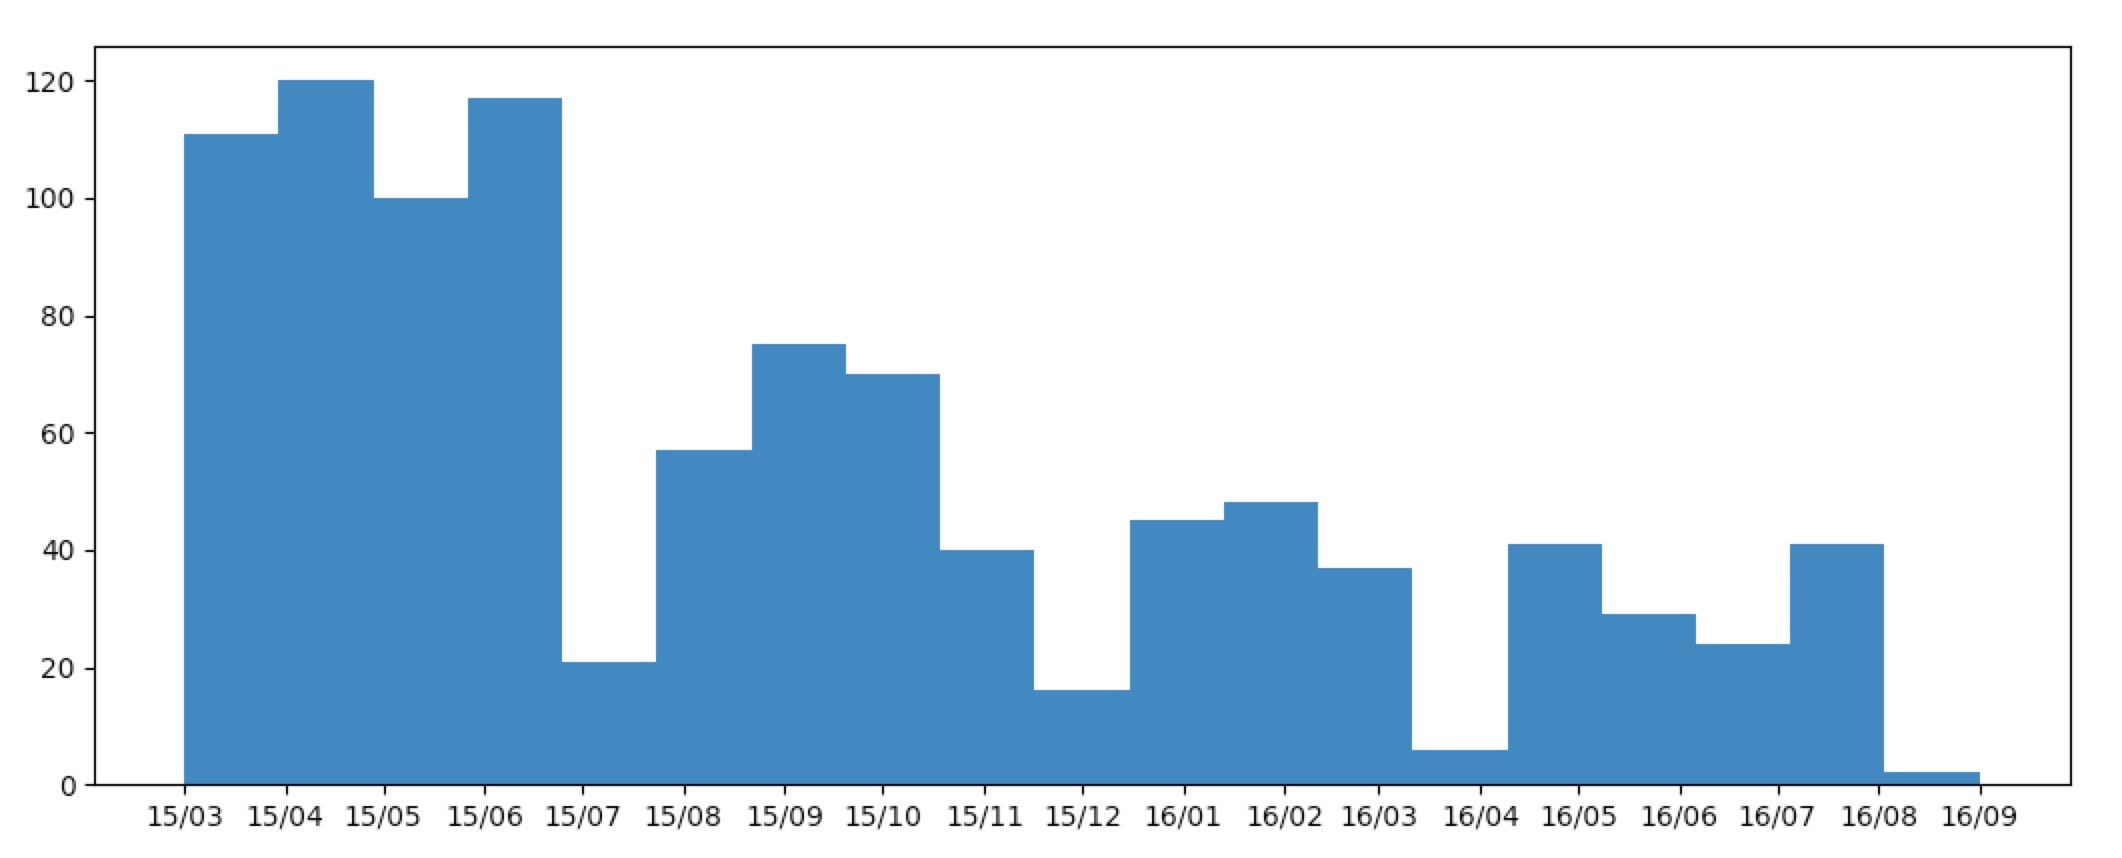
ax.histのbinsの数を大きくするとグラフの幅が狭くなる
bins=100
bins=19
アイテムの数と同じ数をbinsに指定するとこんな感じになる。