Highchartsとは
Javascriptで動作する可視化ライブラリです。
下記のような機能/特徴があります。
- ピュアJavaScript
プラグイン不要、2つのJSファイルだけで動作 - 多彩なチャートタイプ
- 折れ線グラフ
- スプライン曲線
- 面グラフ
- エリアスプライン
- 横棒グラフ
- 縦棒グラフ
- 散布図
- OHLC
- ローソク足
- エリアレンジ
- エリアスプラインレンジ
- レンジセレクタ
- 時系列データを素早く表示
- 時間範囲の選択
1か月、1年、日付指定 - 時間範囲のチャートをズーム
- ツールチップ・ラベル
- データ系列やポイントに関する情報をツールチップ・テキストで表示
- マウスをグラフの上に動かすと、ツールチップが表示
- エクスポートと印刷
- ボタンをクリックして指定のフォーマットでエクスポート
PNG、JPG、PDF、SVG - ウェブ・ページから直接チャートを印刷
- ボタンをクリックして指定のフォーマットでエクスポート
非常に高機能ですが、商用は有償となります。
なぜHighcharts?
きれい
公式サイトのサンプルを見ていただければわかるとおり、色々と工夫をしなくてもきれいでカッコイイグラフが描けます。
かるい
爆速です。
サンプルとして、下記のような1000個の点を7つのグループに色分けした散布図を描画してみます。
import numpy as np
import pandas as pd

num = 1000
x, y = np.random.random((2, num))
labels = np.random.choice(['a', 'b', 'c', 'e', 'f', 'g', 'h'], num)
df = pd.DataFrame(dict(x=x, y=y, label=labels))
下記の代表的な3つのライブラリと比較してみます。
- Matplotlib
- Bokeh
- Plotly
Matplotlib
import matplotlib.pyplot as plt
groups = df.groupby('label')
colors = 'bgrcmyk'
for i, (name, group) in enumerate(groups):
    plt.scatter(group.x, group.y, color=colors[i])
Bokeh
from bokeh.charts import Scatter, output_notebook, show
output_notebook()
show(Scatter(x='x', y='y', color='label', data=df))
Plotly
from plotly.offline import init_notebook_mode, iplot
init_notebook_mode()
groups = df.groupby('label')
data = [{'x': group.x, 'y': group.y, 'mode': 'markers', 'name': name} for name, group in groups]
fig = {'data': data}
iplot(fig)
Highcharts
from highcharts import Highchart

groups = df.groupby('label')
options = {
    'chart': {
        'type': 'scatter',
    },
}
H = Highchart()
H.set_dict_options(options)
for name, group in groups:
    data = list(zip(group.x, group.y))
    H.add_data_set(data, 'scatter', name)
H
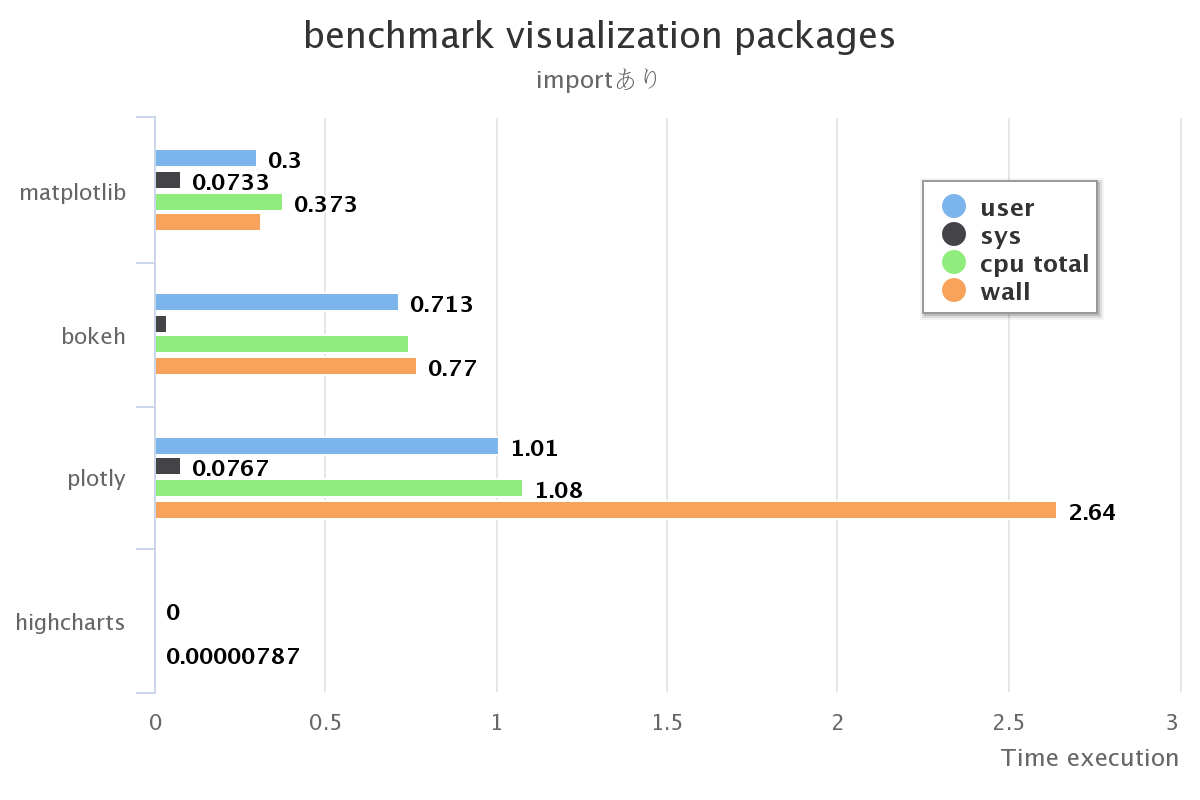
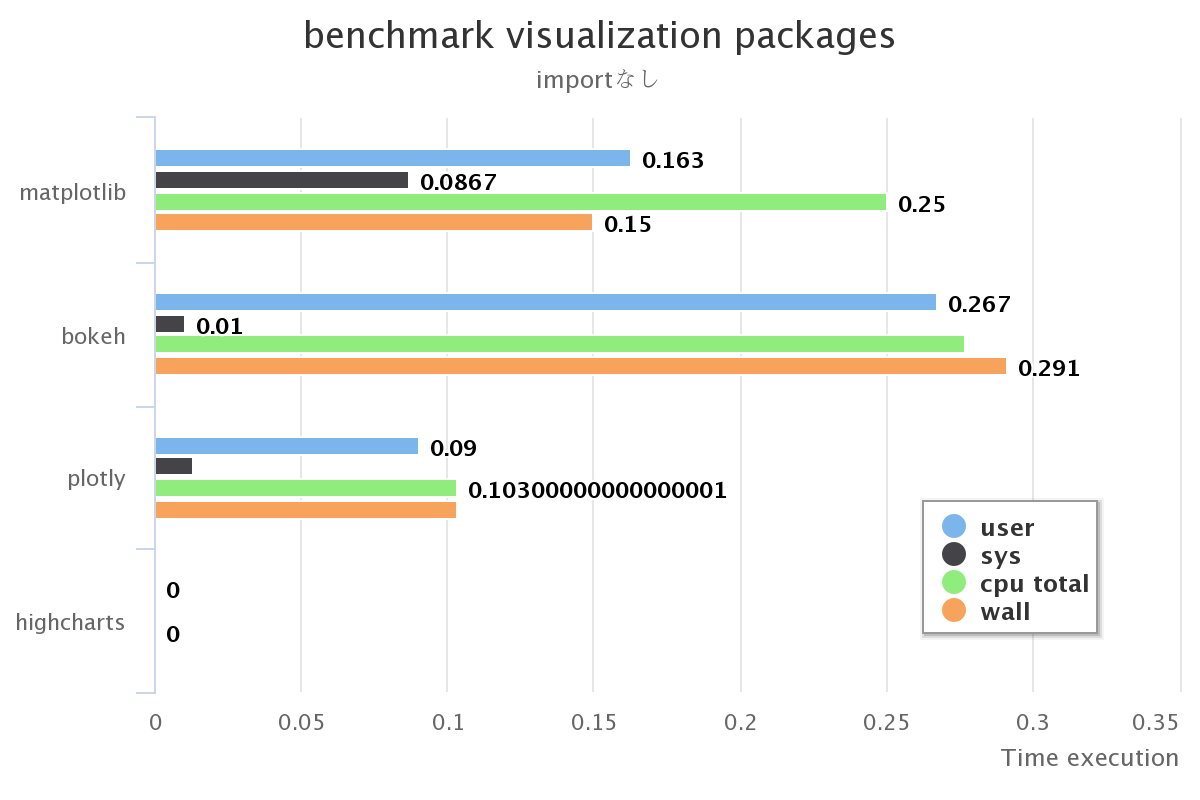
結果はこんな感じになります。
import(初期化)含む
import(初期化)含まない
理由は色々考えられますが、とにかく軽いですね。
%%htmlマジックで実装
HighchartsはJavaScriptのライブラリなので、Jupyter notebookで使うには少し工夫をする必要があります。
テンプレートエンジン等を使用する手段もありますが、単純な例として%%htmlマジックを使ってみます。
from IPython.display import HTML
%%html
    <script src="http://code.highcharts.com/highcharts.js"></script>
    <script src="http://code.highcharts.com/modules/exporting.js"></script>
    <div id="container" style="width:300px; height:200px;"></div>
    <script>
        plot = function () {
            $('#container').highcharts({
                chart: {
                    type: 'line'
                },
                series: [{
                    data: [1, 2, 3]
                }]
            });
        };
        plot();
    </script>
python-highchartで実装
前述した%%htmlマジックでは、単にJavaScriptを書いているだけでPythonではありません。更に変数をハンドリングしたいときにテンプレートエンジン等を使う必要があり、色々と面倒です。
そこで、PythonからHighchartsを呼び出せるpython-highchartsを使ってみます。
インストール
pipでインストールできます。
pip install python-highcharts
線グラフ
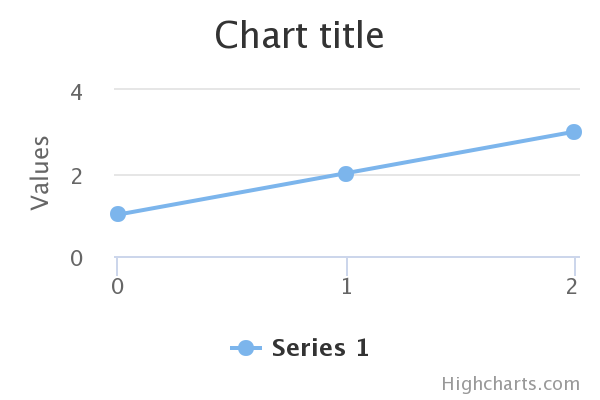
前述の%%htmlマジックで実装した線グラフと同じものをpython-highchartsで実装すると下記のようになります。
from highcharts import Highchart

H = Highchart(width=300, height=200)
H.add_data_set([1, 2, 3])
H
非常にすっきりして、しかもPythonで書けるようになりました。
グラフのオプション
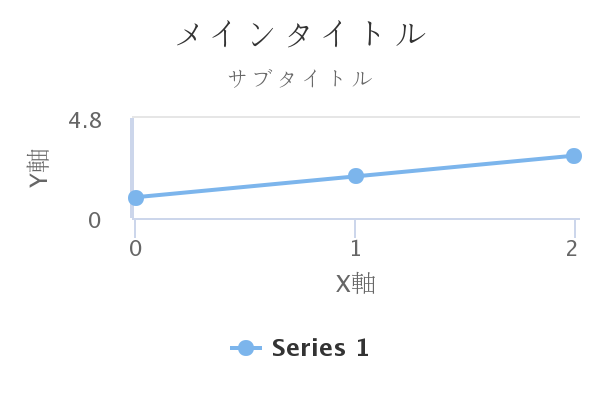
グラフの体裁等はhighcharts.Highchart.set_options()に辞書型の値を渡します。
設定可能な値はHighchartsのリファレンスを参照してください。
from highcharts import Highchart

H = Highchart(width=300, height=200)
options = {
    'title': {
        'text': 'メインタイトル'
    },
    'subtitle': {
        'text': 'サブタイトル'
    },
    'xAxis': {
        'title': {'text': 'X軸'}
    },
    'yAxis': {
        'title': {'text': 'Y軸'},
        'lineWidth': 2
    },
}
H.set_dict_options(options)
H.add_data_set([1, 2, 3])
H
個別のパラメータ毎に設定することも可能です。
こちらのほうが可読性が高いかもしれません。
from highcharts import Highchart

H = Highchart(width=300, height=200)
H.set_options('title', {'text': 'メインタイトル'})
H.set_options('subtitle', {'text': 'サブタイトル'})
H.set_options('xAxis', {'title': {'text': 'X軸'}})
H.set_options('yAxis', {'title': {'text': 'Y軸'}, 'lineWidth': 2})
H.add_data_set([1, 2, 3])
H
要素の体裁はhighcharts.Highchart.add_data_set()で設定します。
from highcharts import Highchart

H = Highchart(width=300, height=200)
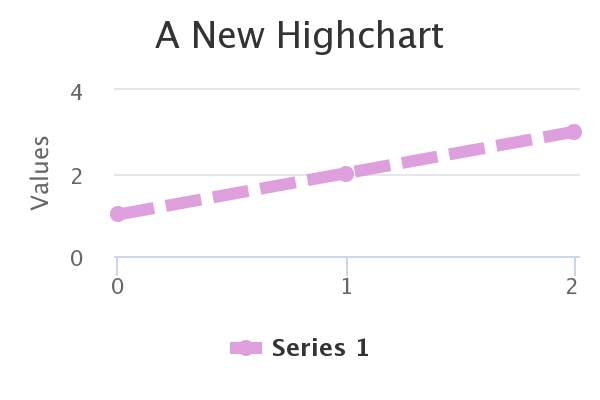
H.add_data_set([1, 2, 3], dashStyle='ShortDash', color='plum', lineWidth=6)
H
グラフの種類
highcharts.Highchart.add_data_set()の第二引数にグラフの種類を指定します。各位置パラメータの指定は下記のとおりです。
| 位置パラメータ | オブジェクト | 型 |
|---|---|---|
| 1 | データセット | リスト、タプル |
| 2 | グラフの種類 | 文字列 |
| 3 | 名前 | 文字列 |
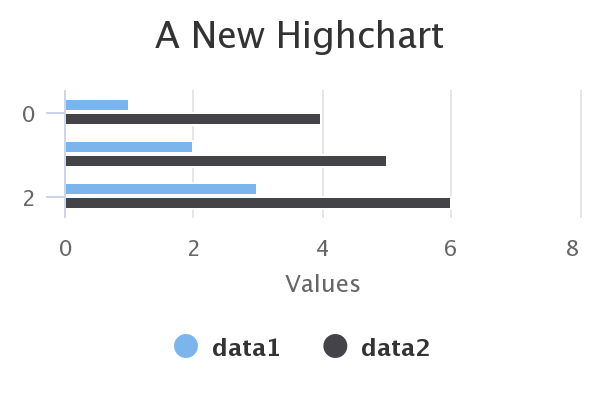
下記の例では1番目の要素をdata1という名前の面グラフ、2番めの要素をdata2という名前の棒グラフを出力しています。
from highcharts import Highchart

H = Highchart(width=300, height=200)
H.add_data_set([1, 2, 3], 'area', 'data1')
H.add_data_set([4, 5, 6], 'bar', 'data2')
H
ドリルダウン
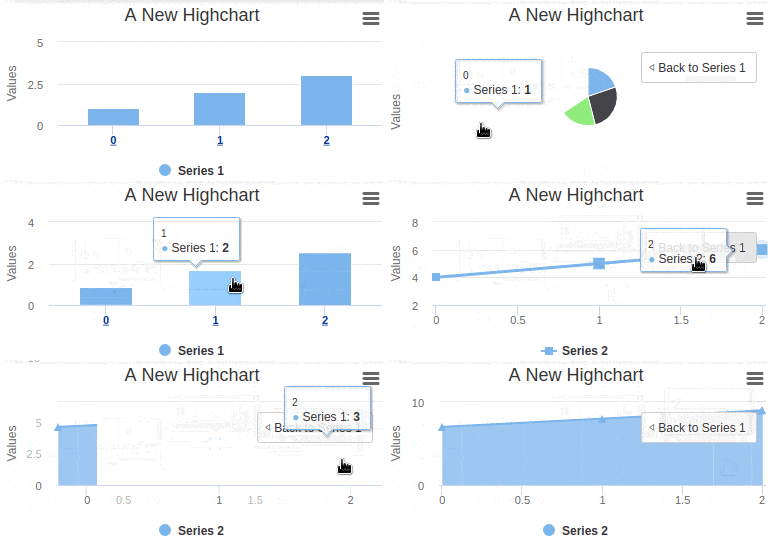
グラフの要素をクリックすると、更に別なグラフが表示される・・・なんてことが可能です。
highcharts.Highchart.add_data_set()の各要素に辞書型のデータを渡します。辞書のキーにdrilldown、値にドリルダウンに対応する名前を設定します。
ドリルダウン後の要素の指定はhighcharts.Highchart.add_drilldown_data_set()に前述した位置パラメータの3つの引数を指定します。3つ目の名前と上位の要素を対応させます。
from highcharts import Highchart

H = Highchart(width=400, height=200)
data = [{
    'y': 1,
    'drilldown': 'a'
}, {
    'y': 2,
    'drilldown': 'b'
}, {
    'y': 3,
    'drilldown': 'c'
}]
H.add_data_set(data, 'column')
H.add_drilldown_data_set([0.3, 0.4, 0.3], 'pie', 'a')
H.add_drilldown_data_set([4, 5, 6], 'line', 'b')
H.add_drilldown_data_set([7, 8, 9], 'area', 'c')
H
おまけ(やきうhack)
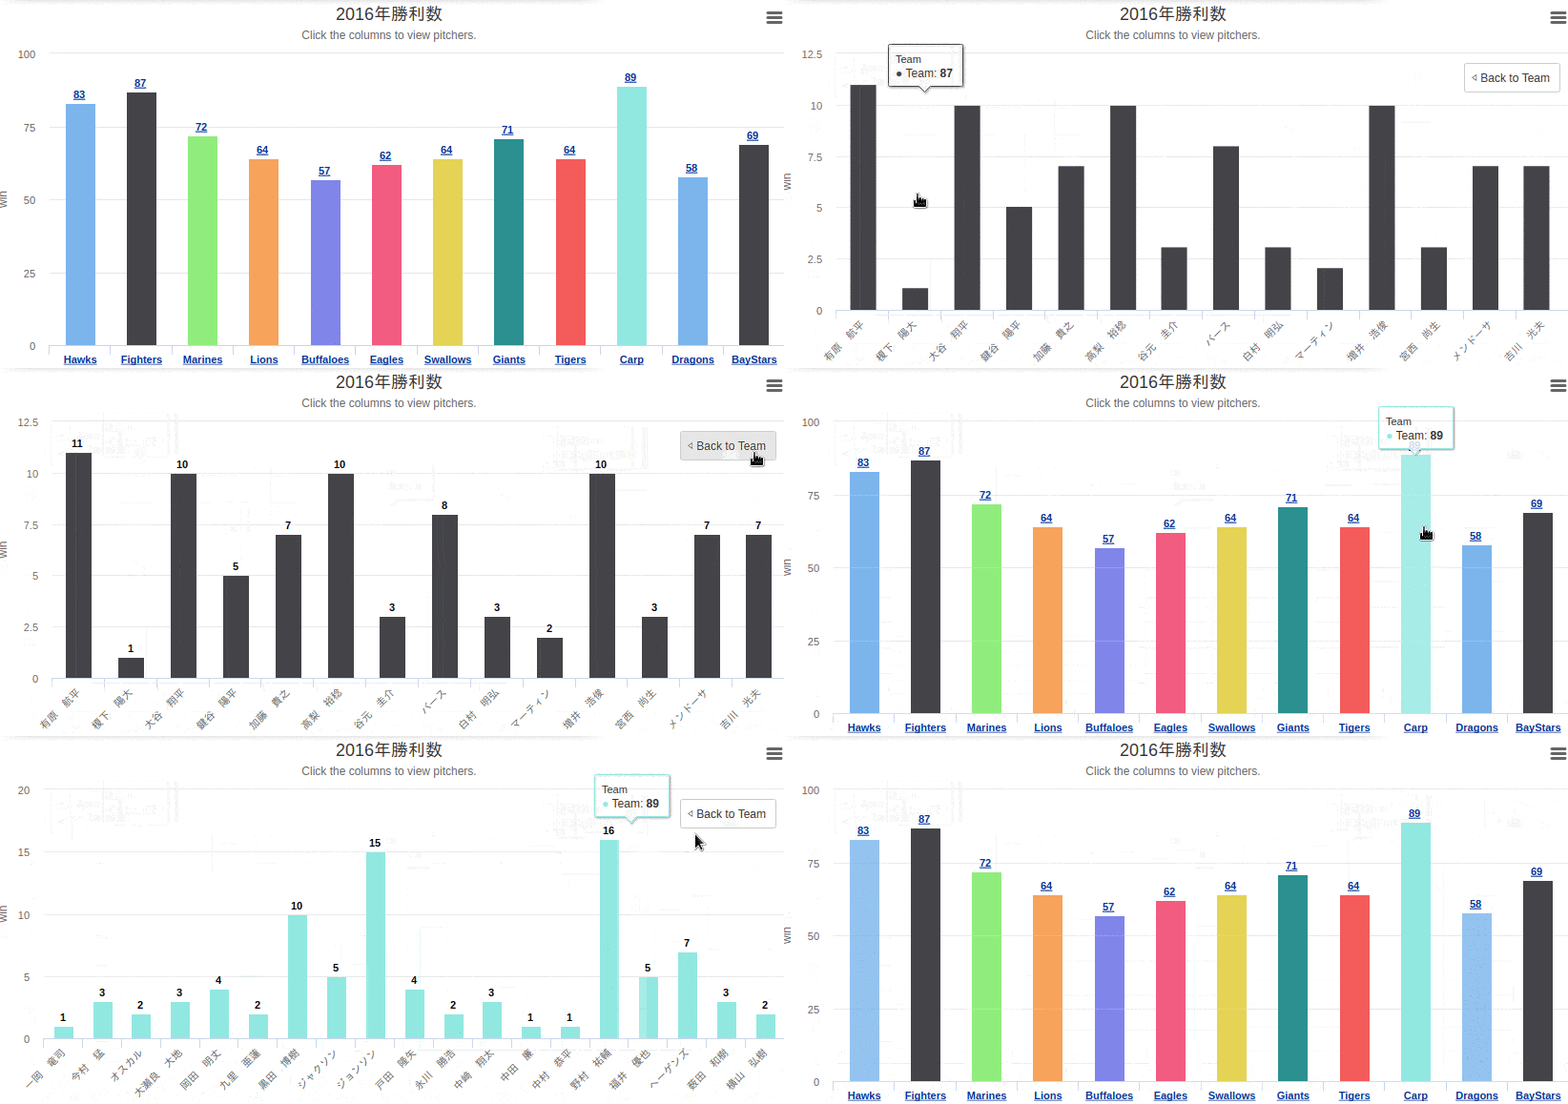
ドリルダウンを利用した例として、2016年のプロ野球12球団の勝利数を棒グラフに表示し、各要素をクリックすると、投手の勝利数が出力されるグラフを作成してみます。
import pandas as pd
from highcharts import Highchart


class Team:
    def __init__(self):
        self.team_names = ['Hawks', 'Fighters', 'Marines', 'Lions',
                           'Buffaloes', 'Eagles', 'Swallows', 'Giants',
                           'Tigers', 'Carp', 'Dragons', 'BayStars']
        self.urls = [self.make_url(x) for x in self.team_names]
        self.dfs = [self.load_pitcher_win_data(url) for url in self.urls]
        self.wins = [df['win'].sum() for df in self.dfs]
        self.team_data = [
            self.make_y_dict(team_name, wins)
            for team_name, wins in zip(self.team_names, self.wins)
        ]
        self.pitcher_data = [df.values.tolist() for df in self.dfs]

    def make_url(self, team_name):
        def join_url(x):
            return ''.join(('http://npb.jp/bis/2016/stats/idp1_', x, '.html'))

        if team_name == 'Buffaloes':
            return join_url('bs')
        elif team_name == 'BayStars':
            return join_url('db')
        else:
            return join_url(team_name[0].lower())

    def load_pitcher_win_data(self, url):
        tables = pd.read_html(url)
        df = tables[0].iloc[2:, [1, 3]]
        df.columns = ['pitcher', 'win']
        df['win'] = df['win'].astype(float)
        return df[df['win'] > 0]

    def make_y_dict(self, team_name, wins):
        return {'name': team_name, 'y': wins, 'drilldown': team_name}

t = Team()

options = {
    'chart': {
        'type': 'column'
    },
    'title': {
        'text': '2016年勝利数'
    },
    'subtitle': {
        'text': 'Click the columns to view pitchers.'
    },
    'xAxis': {
        'type': 'category'
    },
    'yAxis': {
        'title': {
            'text': 'win'
        }
    },
    'legend': {
        'enabled': False
    },
    'plotOptions': {
        'series': {
            'borderWidth': 0,
            'dataLabels': {
                'enabled': True,
            }
        }
    },
    'tooltip': {
        'headerFormat':
        '<span style="font-size:11px">{series.name}</span><br>',
    },
}


H = Highchart(width=850, height=400)
H.set_dict_options(options)
H.add_data_set(t.team_data, 'column', "Team", colorByPoint=True)
for i, team_name in enumerate(t.team_names):
    H.add_drilldown_data_set(
        t.pitcher_data[i], 'column', team_name, name=team_name)
H
pandas-highchartsで実装
インストール
pipでインストールできます。
pip install pandas-highcharts
その名のとおり、pandasのDataFrameをHighchartsで描画します。
なんと、pandas_highcharts.display.display_chartsにpandas.DataFrame.plot()と同じ引数を渡すだけでグラフを出力することができます。
import pandas as pd
from pandas_highcharts.display import display_charts

df = pd.DataFrame([1, 2, 3], index=[list('abc')])
display_charts(df, figsize=(300, 200))
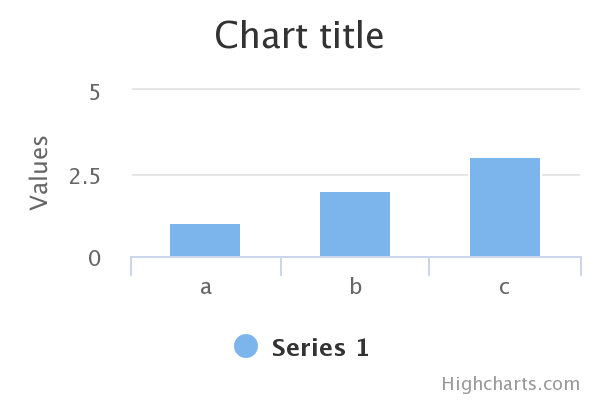
グラフの種類の指定もpandasと同一の記述方法になります。
import pandas as pd
from pandas_highcharts.display import display_charts

df = pd.DataFrame([1, 2, 3], index=[list('abc')])
display_charts(df, kind='bar', figsize=(300, 200))
機能面ではpython-highchartsの方が豊富ですが、pandasのデータを可視化したいならこちらのほうがお手軽ですね。
