Plotly Dashとは
Plotly Dash(正式名称はDashらしいですが、他にもDashという名前のアプリが色々あるのでこの表記とします)はPython製のWebアプリケーションのフレームワークです。
FlaskやBottleなど、Python製のWebフレームワークは色々ありますが、Plotly DashはPlotlyを使用した可視化されたデータを組み込むことができます。
インストール
pipでインストールします。condaでインストールできるかどうかは確認していません。
pip install dash==0.17.7  # The core dash backend
pip install dash-renderer==0.7.4  # The dash front-end
pip install dash-html-components==0.7.0  # HTML components
pip install dash-core-components==0.11.0  # Supercharged components
pip install plotly==2.0.12  # Plotly graphing library used in examples
とりあえずかいてみる
import dash
import dash_core_components as dcc
import dash_html_components as html
import numpy as np

x = np.linspace(-np.pi, np.pi, 10)
y = np.sin(x)
app = dash.Dash()

app.layout = html.Div(children=[
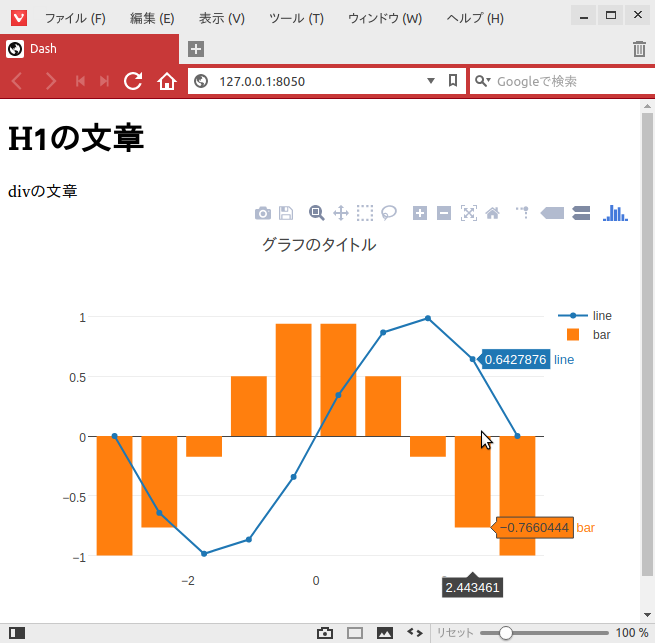
    html.H1(children='H1の文章'),

    html.Div(children='''
        divの文章
    '''),

    dcc.Graph(
        id='example-graph',
        figure={
            'data': [
                {'x': x, 'y': np.sin(x), 'type': 'line', 'name': 'line'},
                {'x': x, 'y': np.cos(x), 'type': 'bar', 'name': 'bar'},
            ],
            'layout': {
                'title': 'グラフのタイトル'
            }
        }
    )
])

if __name__ == '__main__':
    app.run_server(debug=True)
上記のようにHTMLを書く必要はなく、Pythonのコードだけで完結できます。
グラフの描画はPlotlyが担っています。
Markdown
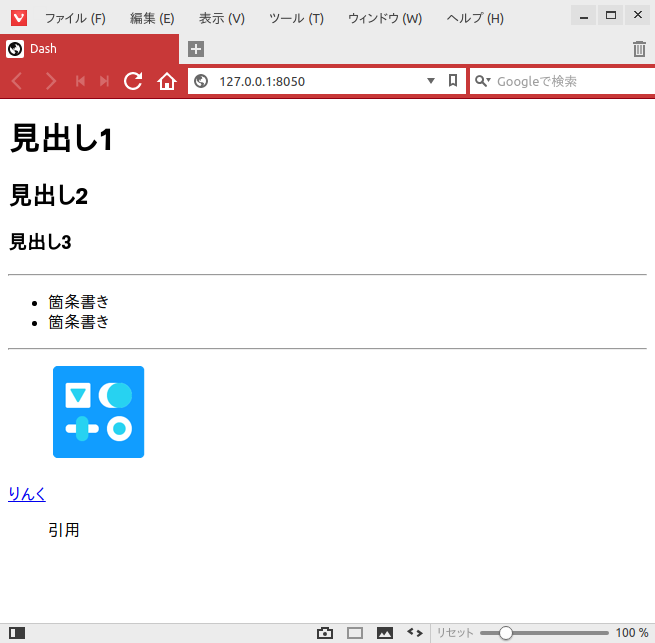
Markdown記法に対応しています。
import dash
import dash_html_components as html
import dash_core_components as dcc
markdown_doc = dcc.Markdown('''
# 見出し1
## 見出し2
### 見出し3
---
* 箇条書き
* 箇条書き
---
[りんく](http://commonmark.org/help)

> 引用
''')
app = dash.Dash()
app.layout = html.Div(markdown_doc)
if __name__ == '__main__':
app.run_server(debug=True)
筆者の環境ではtableが表現できませんでした。もしうまくいった方がいらっしゃいましたら教えてください。
Live Updates
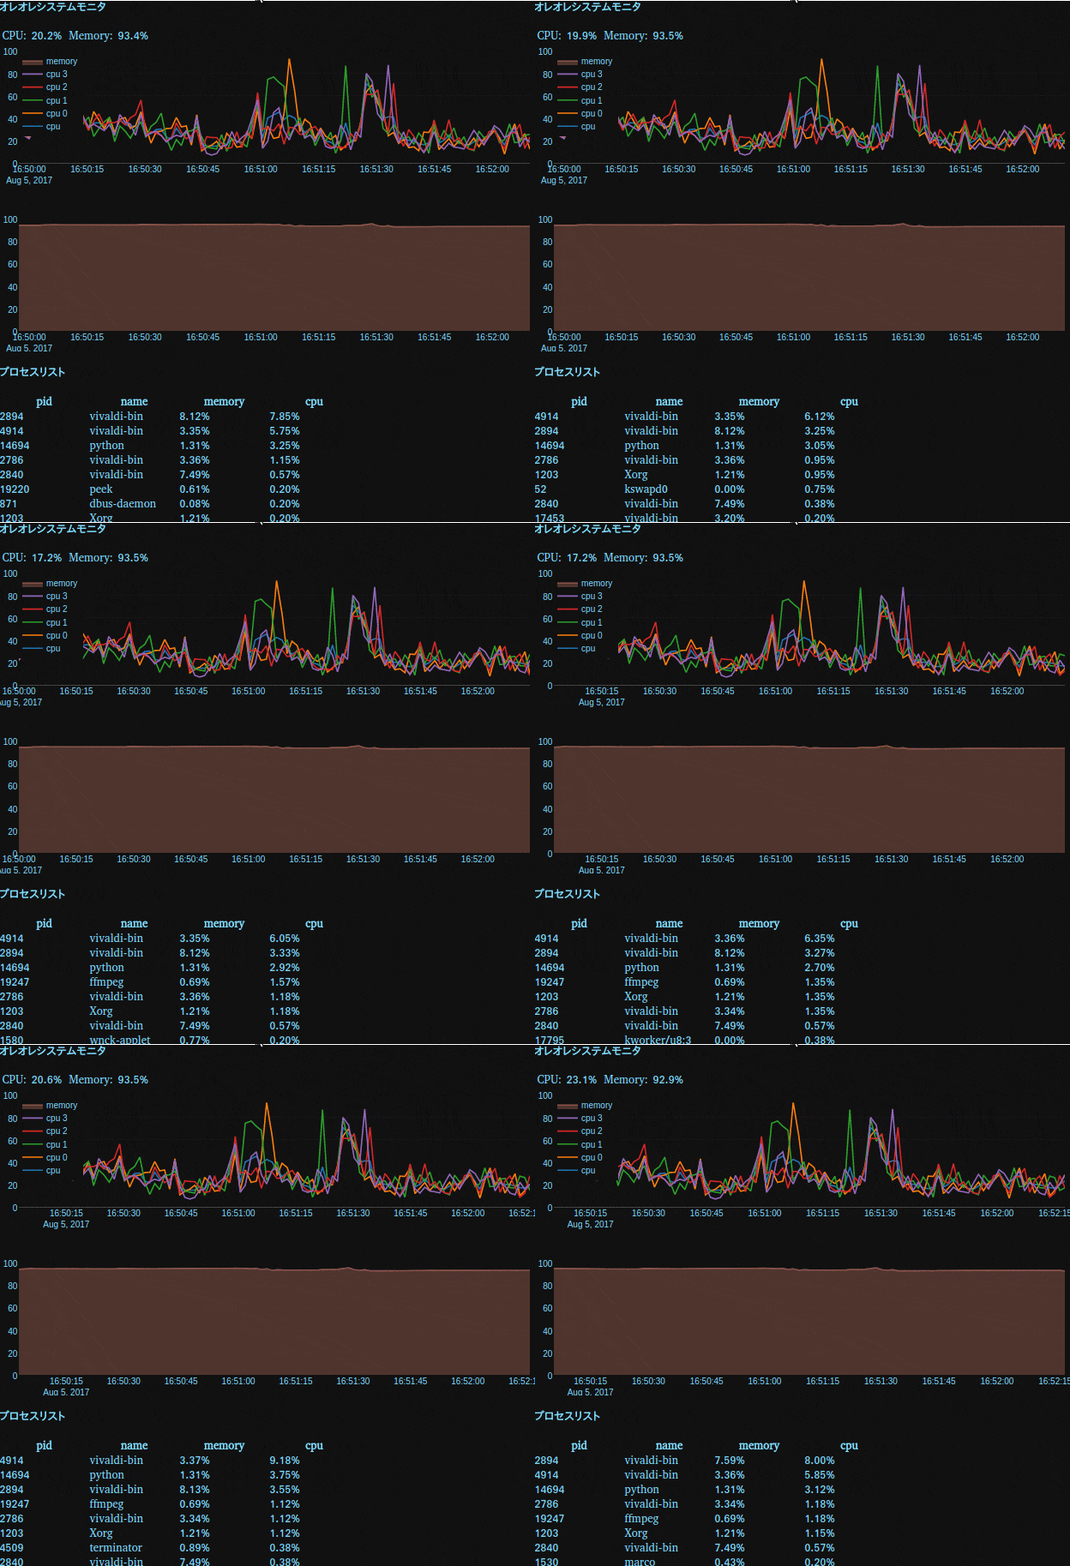
動的なグラフにも対応しています。
下記の例では psutil を使用してマシンのリソース状況をリアルタイムにモニタします。
import dash
from dash.dependencies import Input, Output, Event
import dash_core_components as dcc
import dash_html_components as html
import datetime
import plotly
import numpy as np
import pandas as pd
import psutil

colors = {
    'background': '#111111',
    'text': '#7FDBFF'
}

app = dash.Dash(__name__)
app.layout = html.Div(children=[
    html.Div([
        html.H4('オレオレシステムモニタ'),
        html.Div(id='live-update-text'),
        dcc.Graph(id='live-update-graph'),
        html.H4('プロセスリスト'),
        html.Div(id='live-update-proc'),
        dcc.Interval(
            id='interval-component',
            interval=1 * 1000  # in milliseconds
        )
    ])
],
    style={'backgroundColor': colors['background'], 'color': colors['text']}
)


class Context:
    def __init__(self):
        self.t = []
        self.cpu = []
        self.per_cpu = [[] for x in range(psutil.cpu_count())]
        self.mem = []

    @classmethod
    def append_data(cls, d1, d2):
        n = len(d1)
        if n > 100:
            del d1[0:n - 99]
        d1.append(d2)


context = Context()

# The `dcc.Interval` component emits an event called "interval"
# every `interval` number of milliseconds.
# Subscribe to this event with the `events` argument of `app.callback`


@app.callback(Output('live-update-text', 'children'),
              events=[Event('interval-component', 'interval')])
def update_metrics():
    now = datetime.datetime.now()
    hour, minute, second = now.hour, now.minute, now.second
    style = {'padding': '5px', 'fontSize': '16px'}
    return [
        html.Span('CPU: {}%'.format(context.cpu[-1]), style=style),
        html.Span('Memory: {}%'.format(context.mem[-1]), style=style)
    ]


# Multiple components can update everytime interval gets fired.
@app.callback(Output('live-update-graph', 'figure'),
              events=[Event('interval-component', 'interval')])
def update_graph_live():
    # global context
    context.append_data(context.t, datetime.datetime.now())
    context.append_data(context.cpu, psutil.cpu_percent())
    for data, pct in zip(context.per_cpu, psutil.cpu_percent(percpu=True)):
        context.append_data(data, pct)
    context.append_data(context.mem, psutil.virtual_memory().percent)

    # Create the graph with subplots
    fig = plotly.tools.make_subplots(rows=2, cols=1, vertical_spacing=0.2)
    fig['layout']['margin'] = {
        'l': 30, 'r': 10, 'b': 30, 't': 10
    }
    fig['layout']['plot_bgcolor'] = colors['background']
    fig['layout']['paper_bgcolor'] = colors['background']
    fig['layout']['font'] = {'color': colors['text']}
    fig['layout']['legend'] = {'x': 0, 'y': 1, 'xanchor': 'left'}
    fig['layout']['yaxis1'].update(range=[0, 100])
    fig['layout']['yaxis2'].update(range=[0, 100])

    fig.append_trace({
        'x': context.t,
        'y': context.cpu,
        'name': 'cpu',
        'mode': 'lines',
        'type': 'scatter',
    }, 1, 1)
    for i, y in enumerate(context.per_cpu):
        fig.append_trace({
            'x': context.t,
            'y': y,
            'name': 'cpu {}'.format(i),
            'mode': 'lines',
            'type': 'scatter',
        }, 1, 1)
    fig.append_trace({
        'x': context.t,
        'y': context.mem,
        'name': 'memory',
        'mode': 'lines',
        'type': 'scatter',
        'fill': 'tonexty',
    }, 2, 1)

    return fig


def get_proc_df():
    def get_proc(proc):
        try:
            pinfo = proc
        except psutil.NoSuchProcess:
            pass
        return (pinfo.pid, pinfo.name(), pinfo.memory_percent(), pinfo.cpu_percent())

    data = [get_proc(proc) for proc in psutil.process_iter()]
    df = pd.DataFrame(data, columns=['pid', 'name', 'memory', 'cpu'])
    df['memory'] = df['memory'].map(lambda x: '{:.2f}%'.format(x))
    df['cpu'] = df['cpu'] / psutil.cpu_count()
    df['cpu'] = df['cpu'].map(lambda x: '{:.2f}%'.format(x))
    return df.sort_values('cpu', ascending=False)


@app.callback(Output('live-update-proc', 'children'),
              events=[Event('interval-component', 'interval')])
def generate_table():
    df = get_proc_df()
    max_rows = 10
    return html.Table(
        # Header
        [html.Tr([html.Th(col) for col in df.columns])] +

        # Body
        [html.Tr([
            html.Td(df.iloc[i][col], style={'width': '8em'}) for col in df.columns
        ]) for i in range(min(len(df), max_rows))]
    )


if __name__ == '__main__':
    app.run_server(debug=True)
対話的な操作
UIを操作しながら対話的に出力内容をコントロールすることができます。
やり方はそのうち書きたいと思います。


